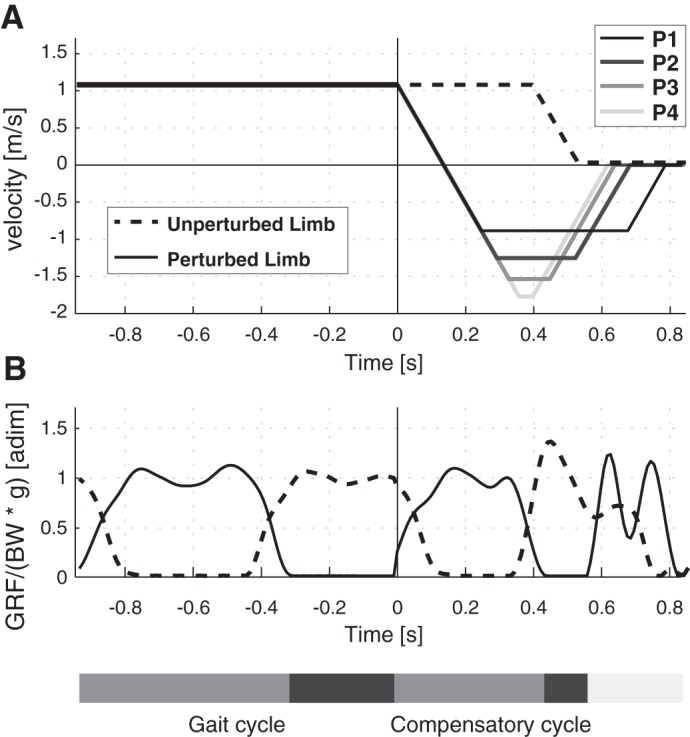
Fig. 1.

Belt velocity profiles (A) and vertical component (B) of the ground reaction force (GRF), normalized to subjects’ body weight (BW) and gravitational acceleration (g), referred to the perturbed and unperturbed limbs (solid and dashed lines, respectively). The time course (in s) of the gait and compensatory cycles is represented along the horizontal axes; 0 s corresponds to the onset of the perturbation. Stance and swing phases of the gait and compensatory cycles are reported in light and dark gray bars, respectively.
