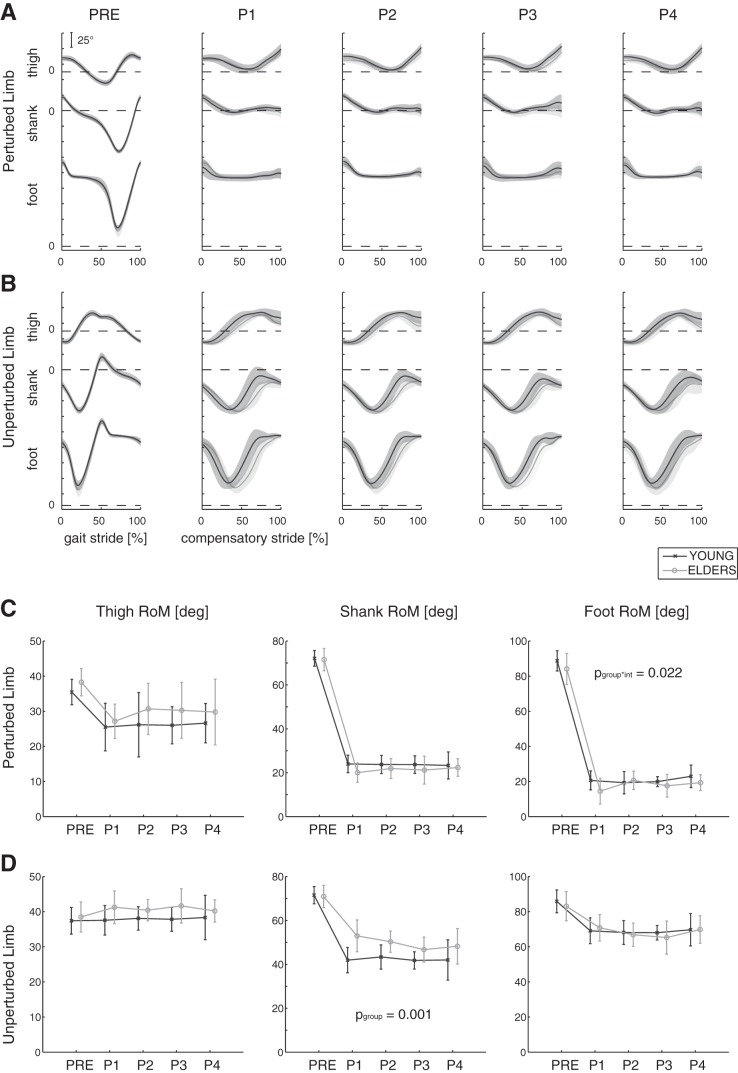
Fig. 3.
A and B: elevation angle profile of thigh, shank, and foot. The time course (in %) of the gait and compensatory cycles is represented along the horizontal axes for both the perturbed (PL; A) and the unperturbed limbs (UL; B); 0 and 100% correspond to 2 consecutive heel strikes of the PL. Mean (bold lines) and 1 SD (shaded areas) are shown for each group (young: n = 10, dark gray; elders: n = 10, light gray) and for all experimental conditions (i.e., PRE, P1, P2, P,3 and P4). C and D. Range of motion (RoM) of elevation angles (means ± 1 SD) is represented for young and elders (dark and light gray, respectively) and for all trials. Significant P values, related to the 2-way ANOVA on data POST, are reported for group (pgoup) and perturbation intensity (pint) factors.

