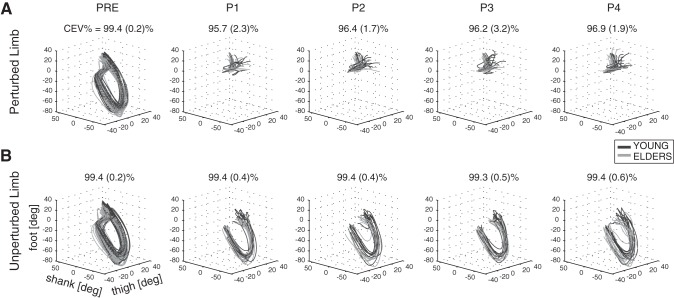
Fig. 4.
Planar covariation of elevation angles at thigh, shank, and foot (3-dimensional position/space) are shown for PL (A) and UL (B). Dark and light gray lines describe trajectories obtained for young (n = 10) and elderly people (n = 10), respectively. Trials performed by each subject are superimposed. The CEV% [i.e., mean value (1 SD) across all subjects] is represented for each limb (PL and UL) and each experimental condition (PRE, P1, P2, P3, and P4).

