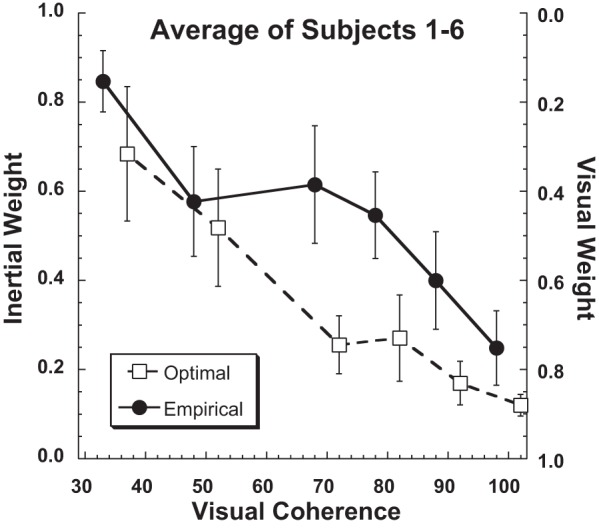
Fig. 8.

Relative weights of the inertial and visual stimuli averaged across subjects. The sum of the visual and inertial weights is always unity. Weights calculated empirically based on bias (Eq. 3) are shown with filled circles (individual subjects) and a solid line (averaged), while those calculated optimally based on the thresholds of single modality (e.g., visual or inertial alone; Eq. 2) are shown with open squares (individual subjects) and a dashed line (averaged). Subject 7 was excluded from the average because the empirical fits were almost all noise due to the minimal offset in visual heading perception with gaze shifts. For clarity the optimal and empirical weights for individual subjects were artificially offset from each other by ±2% visual coherence for clarity.
