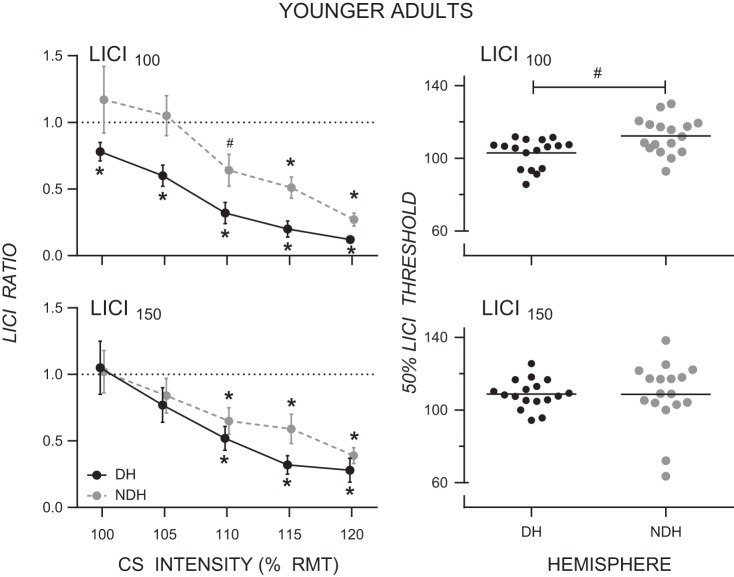
Fig. 2.
Left: mean LICI ratios for the dominant (DH) and nondominant (NDH) hemispheres as a function of conditioning stimulus (CS) intensity for LICI100 (top) and LICI150 (bottom) in younger adults (note: data points are offset for clarity). LICI100 is greater in the dominant than the nondominant hemisphere, and the onset of LICI100 occurs at a lower CS intensity in the dominant than the nondominant hemisphere. Right: threshold for inhibiting the conditioned MEP by 50% (i.e., LICI ratio of 0.5) for the dominant (DH) and nondominant (NDH) hemispheres for LICI100 (top) and LICI150 (bottom) in younger adults. The threshold (as % of RMT) for inhibiting the conditioned MEP by 50% at the ISI of 100 ms was lower in the dominant than the nondominant hemisphere. *LICI ratio significantly different from 1.0 at P ≤ 0.005, Bonferroni correction for multiple comparisons; #LICI ratio significantly different from 1.0 at P < 0.05.

