Fig. 8.
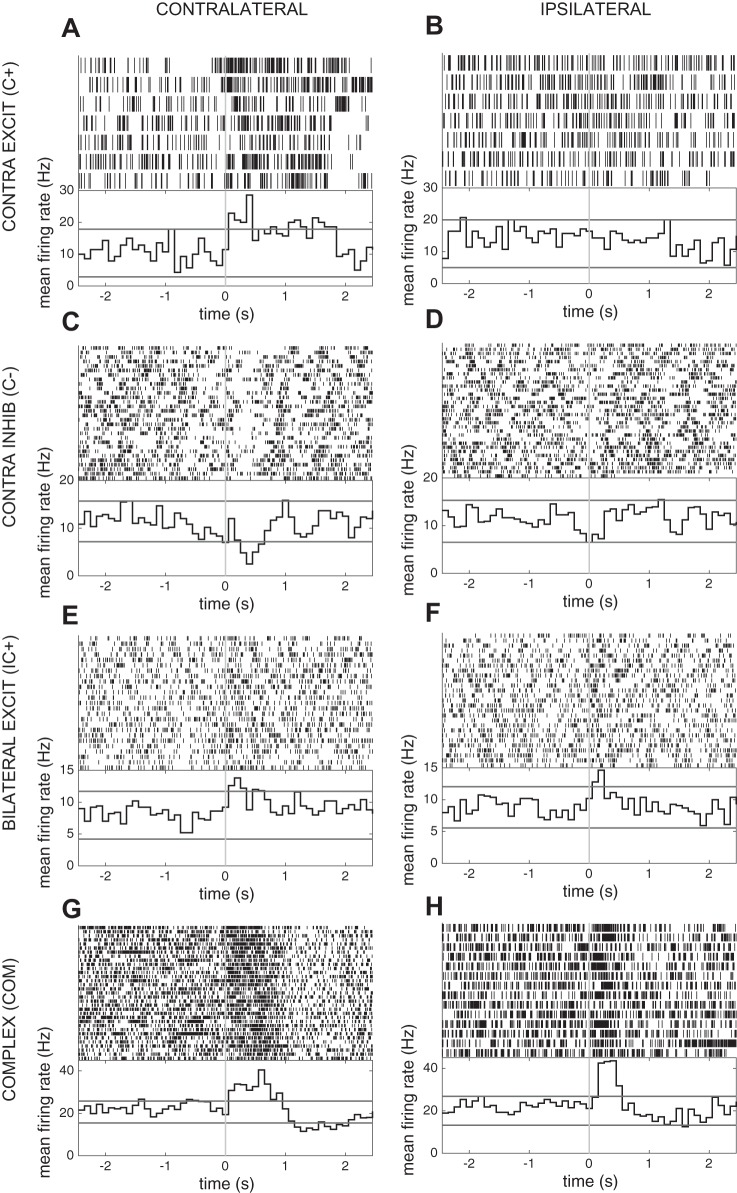
Examples of task-related unit recordings in the STN during the grip task. Spike rasters (top) and average firing histograms (bottom) aligned on contralateral (A, C, E, G) and ipsilateral (B, D, F, H) grip force onset show examples of contralateral excitation (A, B), contralateral inhibition (C, D), bilateral excitation (E, F) and complex responses (G, H). Red lines in average firing histograms represent the 95% confidence intervals based on the baseline distribution. Excit, excitation; Inhib, inhibition.

