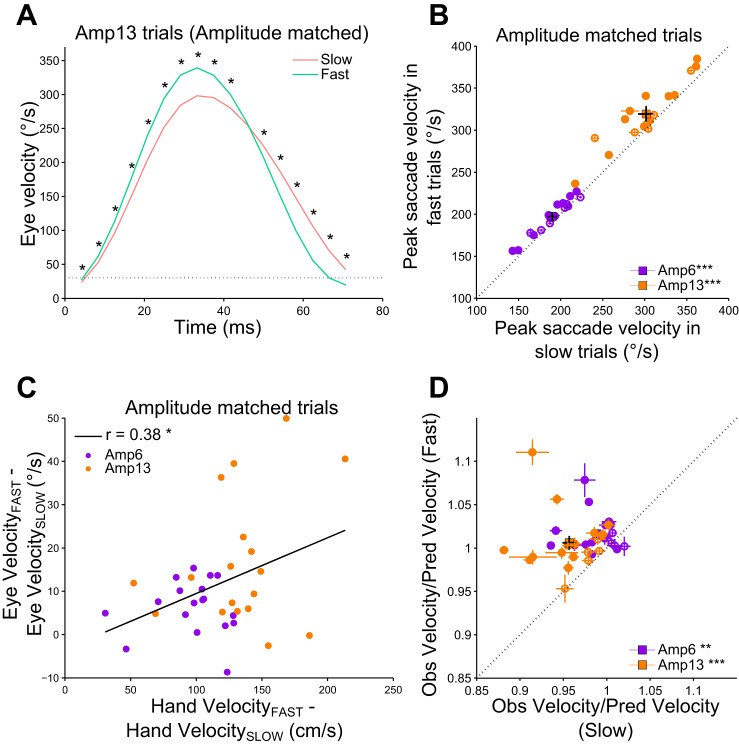
Fig. 2.
Change in peak saccade velocity with hand velocity in amplitude matched trials. A: the average saccade velocity profile for a representative subject in the Amp13 condition. The mean of the instantaneous velocity of the amplitude matched saccades for the fast (green) and slow (red) hand velocity conditions. The time bins at which there is statistical significant difference between the average instantaneous velocities of the saccades are marked with a black asterisk (*P < 0.05). The dotted line represents the velocity cutoff used for detection of saccades. B: comparison of peak saccade velocity in the Amp6 and Amp13 conditions. Each dot and cross-hairs represents the mean ± SE of the peak saccade velocity for a single subject (purple, Amp6; orange, Amp13). Filled circles represent significant difference in peak saccade velocity between the 2 velocity conditions. The square and black cross-hair represents the mean ± SE across the population. The unity line is represented as a black dotted line. C: correlation between the modulation in peak hand velocity and the modulation in peak saccade velocity. Each dot indicates a subject (purple, Amp6; orange, Amp13). The least squares line is shown as a black line. D: comparison of saccade vigor (ratio of the observed peak saccade velocity to the predicted peak saccade velocity) between the fast and the slow trials. Other marking conventions are the same as in B (**P < 0.01 and P > 0.001; ***P < 0.001).

