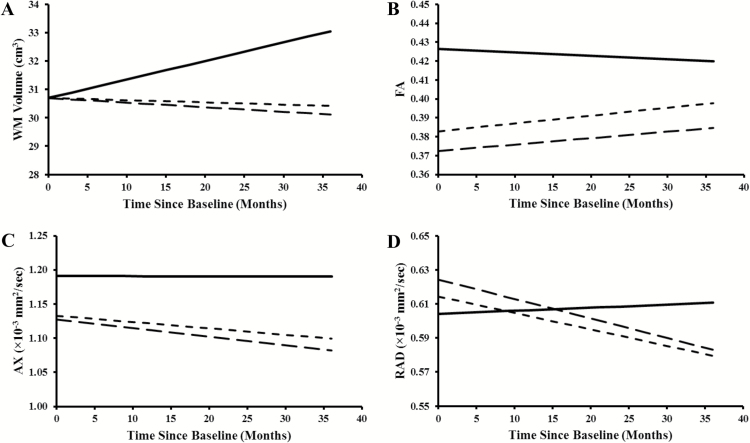
Fig. 1.
Modeled trajectories of (A) white matter volume, (B) fractional anisotropy, (C) axial diffusivity, and (D) radial diffusivity in the right frontal regions of the 3 study groups: controls (solid lines), patients with average-risk disease (dotted lines), and those with high-risk disease (dashed lines). The baseline age assumed for this demonstrative purpose is 8 years for all 4 graphs.

