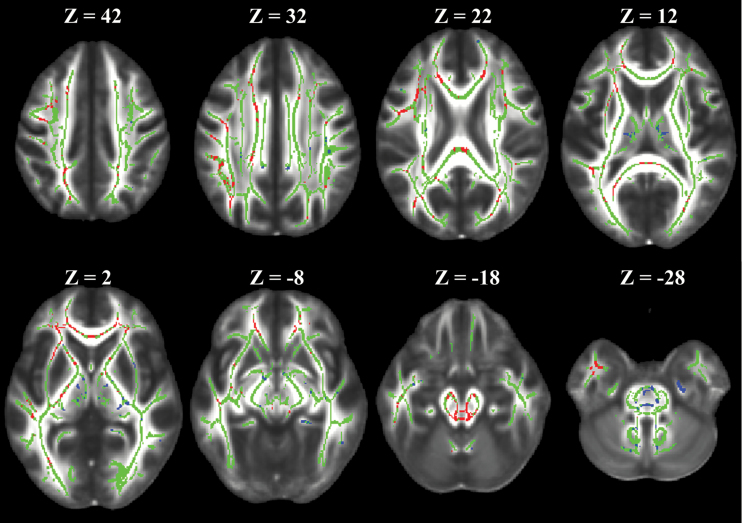
Fig. 2.
Representative images of the TBSS analysis. The images shown are on top of the FMRIB58_FA standard space. The skeleton voxels are presented in green. Voxels where the change in FA over time is greater in patients than in controls are shown in red and confirm the regional analysis results. Voxels where the change in FA over time is lower in patients than in controls are shown in blue and represent specific locations that are not recovering after therapy. The Z position is given in Montreal Neurologic Institute Atlas dimension as a reference.

