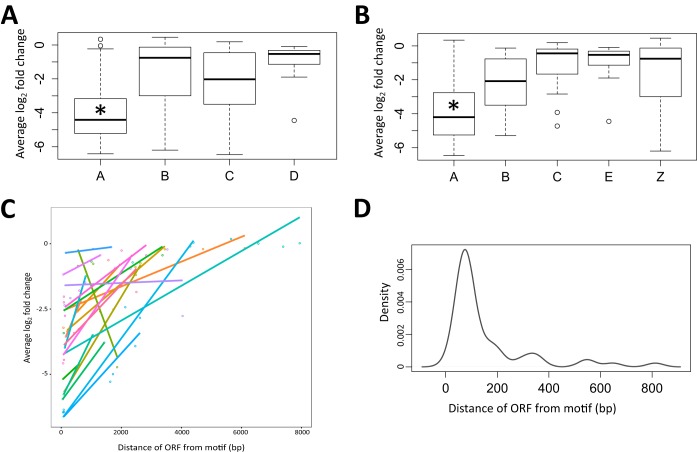
FIG 7 .
Presence of motifs correlated with decreased expression of downstream genes. (A) Single transcription units with a predicted motif upstream (A on the x axis) show a decreased average log2-fold change in the PHB synthesis mutants under nitrogen-limited conditions compared to transcripts with no predicted motif upstream (B on the x axis), operons with a motif upstream (C on the x axis), and operons without a motif upstream (D on the x axis). (B) Transcripts with a predicted motif upstream that are first-order genes (A on the x axis) show a decreased average log2-fold change in the PHB synthesis mutants compared to transcripts from a second-order gene (B on the x axis) or a third-order gene (C on the x axis) with a motif upstream and operons (E on the x axis) and single transcripts (Z on the x axis) with no motif upstream. Asterisks denote statistically significant differences (P > 0.001). (C) Effect size (average log2-fold change) for transcripts in PHB synthesis mutants shows signal decay in operons with a predicted motif upstream (each dot represents a gene, and colored connected dots denote genes in the same operon). (D) First-order genes with a predicted motif upstream tend to be <200 bp away from the predicted motif.

