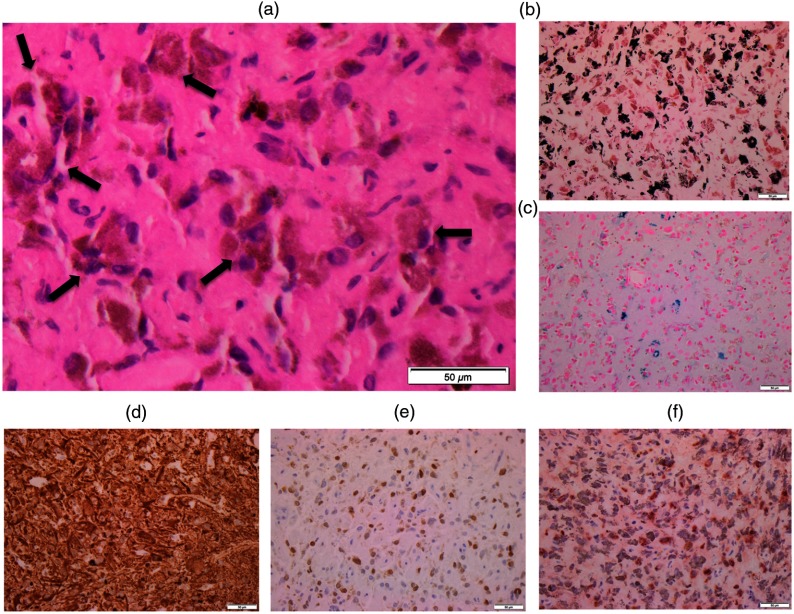
Fig. 2.
Histopathologic findings. (a) H&E stain with an enlarged image. Note many neoplastic cells with abundant brown pigments (allows). Special stains highlight melanin pigments in black (b) on MELN, and iron/hemosiderin pigments in blue (c) on PPB. IHC for (d) GFAP, (e) Neu-N, and (f) tyrosinase. At magnification, the scale bar indicates in actual length.

