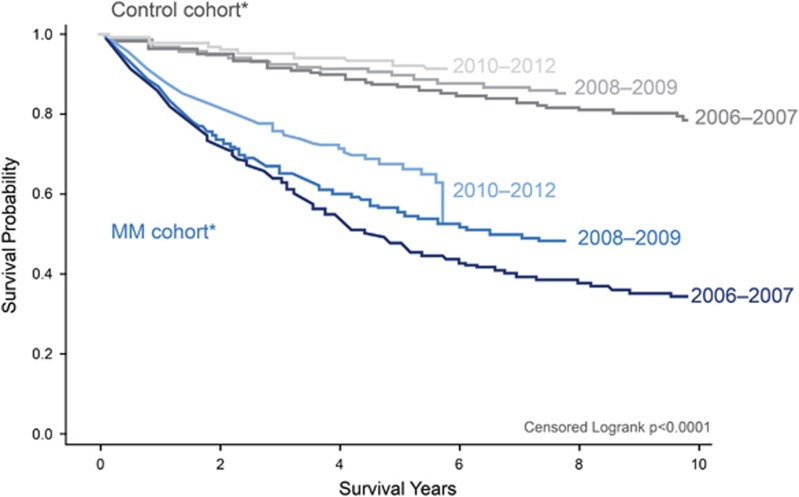
Figure 3.
Survival estimates of matched MM patients and controls, by year of diagnosis. *Year ranges represent the year of diagnosis. Log-rank tests were used to evaluate the difference in survival distributions of two groups. Note: by linking to the SSA Master Death File, survival was measured as time from diagnosis date to the date of death obtained from the SSA, time from diagnosis date to the date of inpatient death, or time from diagnosis date to 30 September 2015; survival estimates were presented for multiple myeloma patients diagnosed and treated during 2006–2012 (n=9521).

