Figure 2.
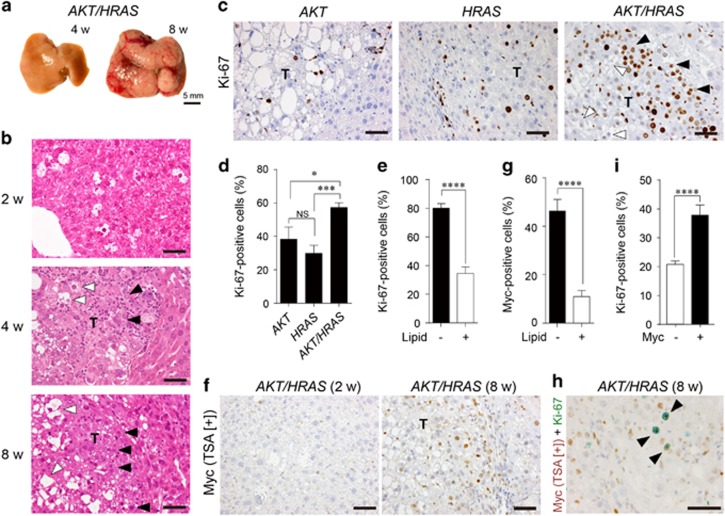
Co-introduction of AKT and HRAS into mouse hepatocytes rapidly induces liver tumours with spontaneous Myc expression. (a) Gross appearances of the livers. Note the white discolouration and multiple large tumours 4 and 8 weeks after introduction of both AKT and HRAS. (b) H&E staining of the liver. Preneoplastic hepatocytes containing abundant intracytoplasmic lipid found after 2 weeks develop into microscopic (4 weeks) and macroscopic (8 weeks) tumours with typical histology of HCC. The tumours consist of cells with (white arrowheads) and without (black arrowheads) lipid accumulation. (c) Immunohistochemistry for Ki-67 comparing AKT-, HRAS- and AKT/HRAS-induced tumours. The cells in AKT/HRAS-induced tumors, particularly those without lipid accumulation, show higher levels of Ki-67 labelling. (d) Quantitative analysis of Ki-67-labelled tumour cells in AKT-, HRAS- and AKT/HRAS-induced tumours (n=10, 12 and 14, respectively). (e) Quantitative analysis of Ki-67-labelling in tumour cells with or without intracytoplasmic lipid accumulation in AKT/HRAS-induced tumours. (f) Myc immunohistochemistry with TSA of AKT/HRAS-induced tumours. Some of the tumour cells without intracytoplasmic lipid accumulation show nuclear Myc expression. (g) Quantitative analysis of Myc protein expression in tumour cells with or without intracytoplasmic lipid accumulation in AKT/HRAS-induced tumours. (h) Myc/Ki-67 double immunohistochemistry of AKT/HRAS-induced tumours. Note the many tumour cells positive for both Myc (brown) and Ki-67 (green) (black arrowheads). (i) Quantitative analysis of Ki-67-labelling in tumour cells with or without Myc expression in AKT/HRAS-induced tumours. T: tumours. Scale bar, 50 μm. Statistical analyses: Kruskal−Wallis test (d), Mann−Whitney U-test (e, g, i). NS, not significant. *P<0.05, ***P<0.001, ****P<0.0001.

