Figure 4.
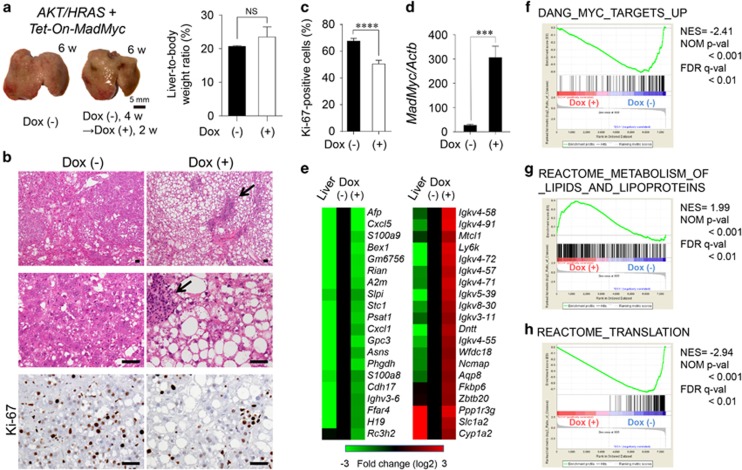
Competitive inhibition of Myc inhibits the proliferative activity of AKT/HRAS-induced tumours. (a) Gross appearances of the livers and liver-to-body weight ratios 6 weeks after the introduction of AKT/HRAS/Tet-On-MadMyc. In the Dox (+) group, at 4 weeks after plasmid injection, Dox was administered during a period of 2 weeks to induce MadMyc (n=5 for Dox [−] group, n=3 for Dox [+] group). (b) H&E staining and immunohistochemistry for Ki-67 of the liver. Intracytoplasmic lipid accumulation is more prominent in tumour cells in the Dox (+) group. There are scattered foci of lymphoplasmacytic infiltration in the stroma (arrows). (c) Quantitative analysis of Ki-67-labelling in tumour cells (10 tumour nodules were examined in each group). (d) RT-qPCR analysis of MadMyc mRNA expression in tumours (n=5 for Dox [−] group, n=8 for Dox [+] group). (e) cDNA microarray analysis of control liver and tumours in the Dox (−) and Dox (+) groups. (e−h) GSEA results showing significant correlations of the expression dataset of the tumours with a ‘Myc target’ gene set (f), a ‘lipid metabolism’ gene set (g), and a ‘translation’ gene set (h). For the Reactome gene sets and GO gene sets, those with subset size less than 100 were excluded. From 10 837 probe sets with gene expression value greater than 25, 7348 known genes were selected by the symbol identifier and used as the expression dataset. Scale bar, 50 μm. Statistical analyses: unpaired t-test (a, c and d). NS, not significant. ***P<0.001, ****P<0.0001.

