Figure 5.
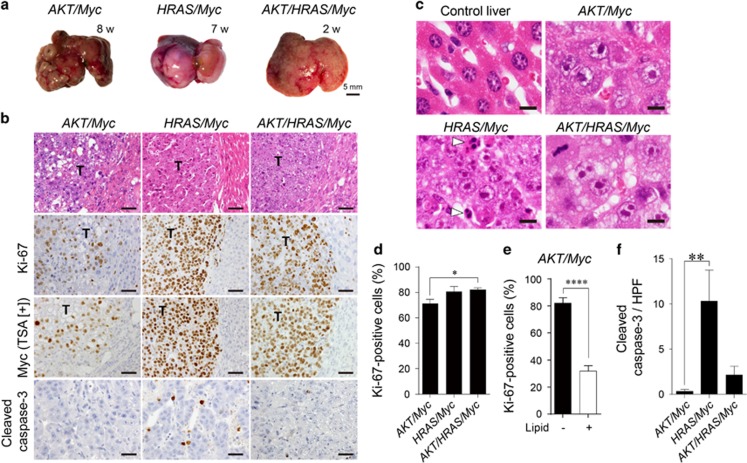
Overexpression of Myc enhances AKT- and/or HRAS-mediated hepatocarcinogenesis with suppression of lipid accumulation in tumour cells. (a) Gross appearances of the livers after introduction of AKT/Myc, HRAS/Myc and AKT/HRAS/Myc. Although multiple liver tumours were generated after 7–8 weeks when AKT/Myc or HRAS/Myc was introduced, the combination of three oncogenes (AKT/HRAS/Myc) induced diffuse liver tumours as early as 2 weeks. (b) H&E staining and immunohistochemistry for Ki-67, Myc (with TSA), and cleaved caspase-3 of the livers 8, 7 and 2 weeks after the introduction of AKT/Myc, HRAS/Myc and AKT/HRAS/Myc, respectively. T: tumours. Scale bar, 50 μm. (c) H&E staining of the normal liver and tumours with Myc overexpression (higher magnification). White arrowheads indicate apoptotic cells in HRAS/Myc-induced tumours. Scale bar, 20 μm. (d) Comparison of cell proliferative activities (percentages of Ki-67-positive cells) among AKT/Myc-, HRAS/Myc- and AKT/HRAS/Myc-induced liver tumours (n=9, 11 and 15, respectively). (e) Relationship between the proliferative activity and lipid accumulation in AKT/Myc-induced tumours. (f) Quantitative analysis of the number of cleaved caspase 3-positive tumour cells per high power field. Statistical analyses: Kruskal−Wallis test (d, f), unpaired t-test (e). *P<0.05, **P<0.01, ****P<0.0001.

