Figure 6.
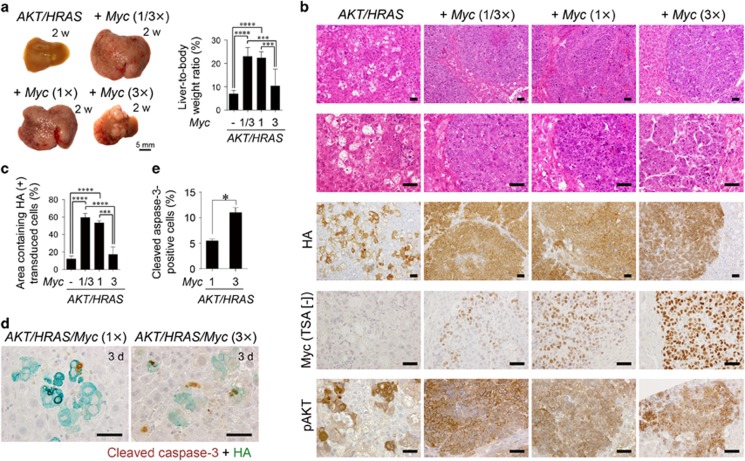
The tumour-promoting effect of Myc overexpression is dependent on its degree of deregulation. (a) Gross appearances of the livers and liver-to-body weight ratios 2 weeks after introduction of AKT/HRAS along with various doses of Myc (0, 1/3 ×, 1 × and 3 × of the original dose used in the previous experiments). (b) H&E staining and immunohistochemistry for HA, Myc (without TSA), and phosphorylated AKT of the livers (2 weeks after the introduction of the indicated oncogenes). (c) Quantitative analyses of the area containing HA-positive transduced cells (2 weeks after the introduction of the indicated oncogenes) (n=6 in each group). A total area of approximately 32 mm2 was analysed in each animal. (d) Double immunohistochemistry for cleaved caspase-3 and HA of the livers 3 days after the introduction of AKT/HRAS/Myc (1 ×) or AKT/HRAS/Myc (3 ×). (e) Quantification of cleaved caspase-3 and HA double-positive cells in AKT/HRAS/Myc (1 ×)- and AKT/HRAS/Myc (3 ×)-induced tumours. Approximately 500 HA-positive cells were analysed in each animal. Scale bar, 50 μm. Statistical analyses: one-way ANOVA with Tukey post-hoc test (a, c), Mann−Whitney U-test (e). *P<0.05, ***P<0.001, ****P<0.0001.

