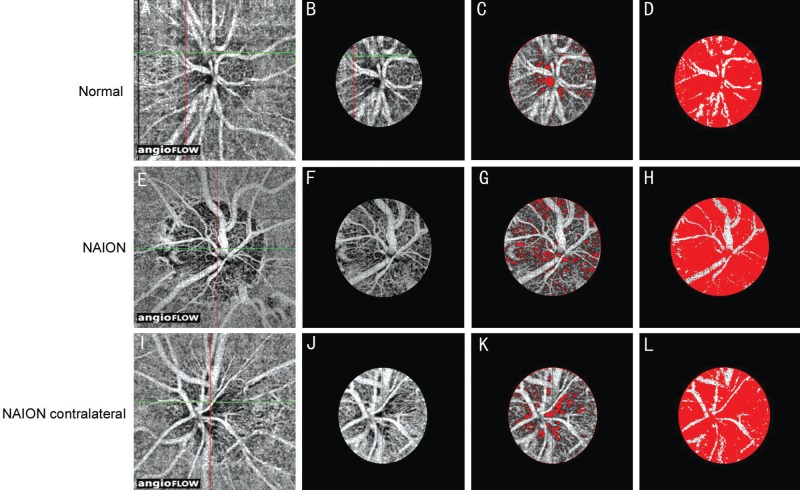
Figure 1. Optic disc blood flow index via optical coherence tomography angiography.
A, E, I: Optic disc-centred 4.50×4.50 mm2 OCT angiograms; B, F, J: Selected optic disc OCT angiograms; C, G, K: Optic disc non-perfusion areas; D, H, L: Optic disc areas (except major branch retinal blood vessels). A-D: In the eyes of a normal subject; E-H: NAION eye; I-L: Contralateral eye of a NAION patient. The non-perfusion areas are marked in red (C, D, G, H, K, L).

