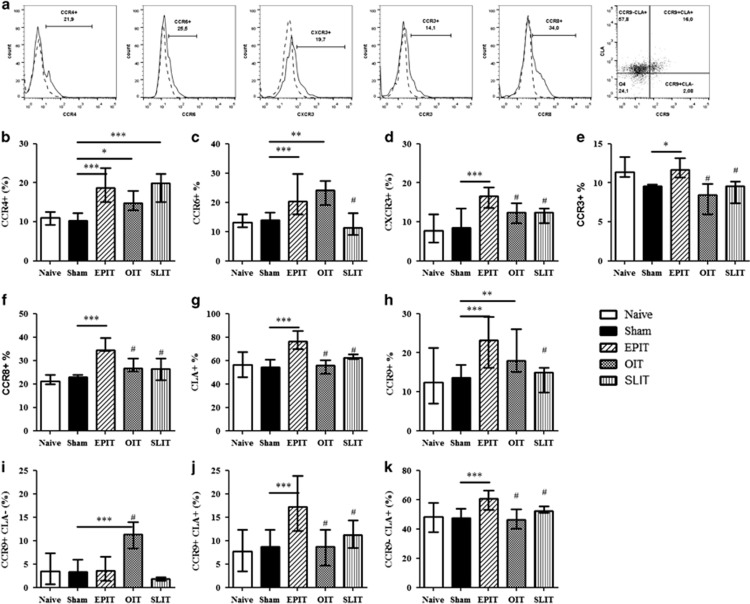
Figure 5.
Expression of homing receptors on Tregs in the spleen. Sensitized mice were EPIT-, OIT-, SLIT- or sham-treated for 8 weeks. At the end of treatment, the spleen cells were harvested for flow cytometry analysis. Using the same gating strategies, the cells were gated on CD4+CD25+Foxp3+ and the percentages of expression of homing receptors were analyzed, as shown by a representative histogram and dot plot (a). The percentages of cells expressing CCR4 (b), CCR6 (c), CXCR3 (d), CCR3 (e), CCR8 (f), CLA (g) or CCR9 (h) were analyzed. Double staining was used for the expression of CLA and CCR9 to analyze the percentage of CD4+CD25+Foxp3+ cells expressing either only CLA (CCR9-CLA+) (i), both CCR9 and CLA (CCR9+CLA+) (j) or only CCR9 (CCR9+CLA−) (k). The data are shown as the median with range from three independent experiments with n=6 for each group of mice. *P<0.05; **P<0.01; ***P<0.001; #P<0.05 compared with EPIT.

