Fig. S1.
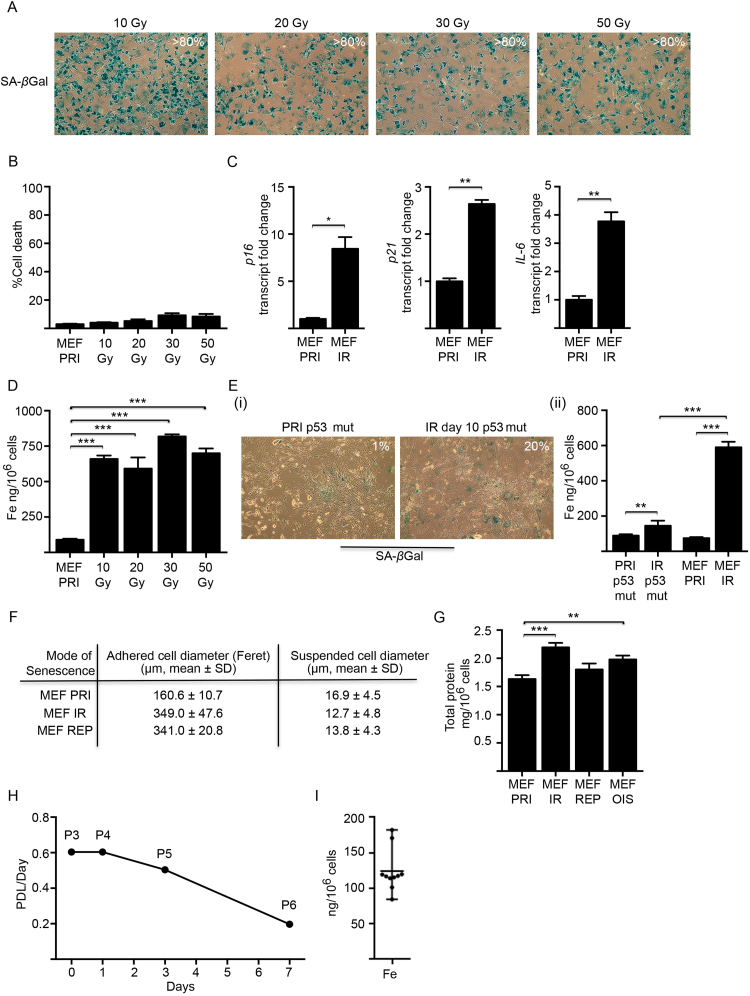
Relevant experimental controls for inducing cellular senescence. (A) Primary MEFs were exposed to a range of gamma irradiation (10–50 Gy) doses to induce senescence. Across all doses the majority (> 80%) of MEFs displayed positive SA-βgal activity at 10 days post-irradiation (blue staining). (B) The viability of MEFs exposed to a range of gamma irradiation (10–50 Gy) doses was determined by propidium iodide and flow cytometry at 10 days post-irradiation. There was no change in cell viability across the doses. (C) Real time qPCR analyses showed elevated mRNA transcripts for senescence-associated genes p16, p21 and IL-6 in senescent MEFs (MEF IR) at 21 days post-irradiation (10 Gy). Levels were normalised against GAPDH and expressed as fold change relative to primary MEFs (MEF PRI). (D) ICP-MS analyses demonstrated that MEFs exposed to a range of gamma radiation dose (10–50 Gy) all accumulated similar levels of elevated intracellular iron at 10 days post-irradiation. (E) Irradiated p53 mutant MEFs (IR p53 mut) displayed (i) significantly lower SA-βgal positivity (~ 20%) compared to wild-type MEFs (~ 80%) at 10 days post-irradiation (10 Gy) and (ii) had a negligible increase (< 2-fold) in intracellular iron, as determined by ICP-MS analyses. Non-irradiated p53 mutant MEFs (PRI p53 mut) had comparable intracellular iron levels when compared to non-irradiated p53 wild type MEFs (MEF PRI). Senescenct wild-type MEFs (MEF IR) are included for comparison. (F) MEFs induced to become senescent [irradiation (IR) or replicative exhaustion (REP)] have increased adhered cell diameter (Feret) (≥ 2 fold) compared to primary MEFs (MEF PRI), but comparable cell diameter in suspension following trypsinization. Cells were imaged using a bright field inverted microscope (Olympus IX51) and subsequently photographed (Canon 1100D). Feret diameter (caliper length) was determined using ImageJ software (n = 3). Suspended cell diameter (post-trypsinization) was determined using a Beckman Coulter Z Series Cell Count and Size Analyser (n = 3). (G) Cellular protein content as a marker for overall cell mass and volume. Irradiated (MEF IR), replicative (MEF REP) and oncogenic-induced (MEF OIS) senescent MEFs contained ~ 1.3-fold, ~ 1.1-fold and ~ 1.2-fold more protein in comparison to primary MEFs (MEF PRI), respectively. Cellular protein concentrations were determined using the BCA protein assay kit (Thermo Scientific) as per manufacturer’s instructions. Total protein was expressed as mg per 106 cells and represented as mean ± SD (n = 3). (H) Proliferating primary MEFs lose replicative potential as a result of continual passaging. The population-doubling limit per day (PDL/day) reached 0.2 at passage 6 prior to cell cycle arrest at passage 7 (senescence). Population doubling was determined by the following formula: n = 3.32 (log UCY − log l) + X, where n = the final PDL number at end of a given subculture, UCY = the cell yield at that point, l = the cell number used as inoculum to begin that subculture, and X = the doubling level of the inoculum used to initiate the subculture being quantitated. (I) Natural variance in intracellular iron concentration between primary MEFs derived from different embryos (same pregnancy) ICP-MS analyses of isogeneic C57BL/6 MEF lines (n = 10) showed a range of intracellular iron (84.2–181.9 ng/106 cells) concentrations. Data represented as mean ± range (n = 10). Statistical analysis was performed by student-t-test: significant (*p < 0.05, **p < 0.01, ***p < 0.001).

