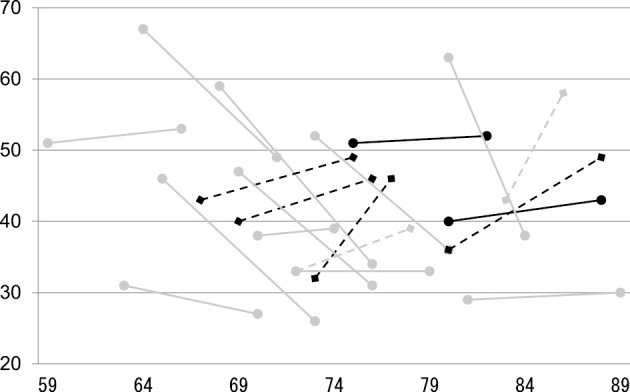
Figure.

The time course of the total SDS scores in the 19 SMON patients. Dotted lines: Six patients with a ≥10% an increase in their total SDS score (aggravation group). Continuous lines: Thirteen patients in whom the total SDS score decreased or increased by <10% (non-aggravation group). Dark color: Six patients who used wheelchairs during their daily life. Vertical axis: The total SDS scores. Horizontal axis: the age of the patients at the time of the SDS examinations.
