
Fig. 1. AUDIT-C score trajectories among 3539 HIV-infected participants in the VACS, 2002–2010. AUDIT-C; alcohol use disorders identification test-consumption; VACS, Veterans Aging Cohort Study.
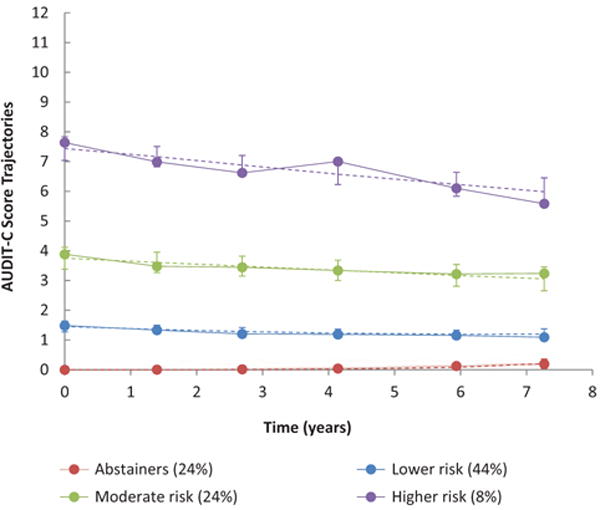
Dashed lines represent predicted values and error bars represent 95% confidence intervals for each wave’s estimate; solid lines represent empirical averages. Time points are based on the average time since baseline for each of the six waves of data collection during the 8-year study period.