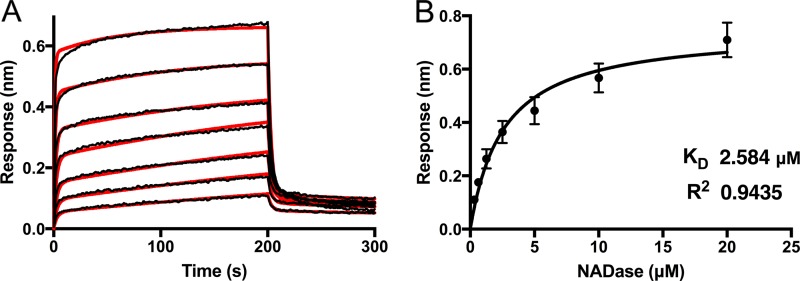
FIG 6 .
Biolayer interferometry (BLI) analysis of NADase binding to SLO. (A) Kinetic analyses of the interaction between full-length NADase and SLO were performed using biolayer interferometry. SLO was immobilized on a biosensor tip, and the binding of incremental 2-fold increases in concentrations of NADase from 312.5 nM to 20 μM was observed. The association and dissociation phases of the experiment are shown. Individual response curves are shown for increasing NADase concentrations. The data were fitted to a biphasic binding model (overlaid in red). (B) An overall dissociation constant (KD) of 2.58 μM ± 0.38 μM was determined from steady-state analysis of the BLI response versus NADase concentration determined late in the association phase. All experiments were repeated three times. Error bars represent standard deviations.

