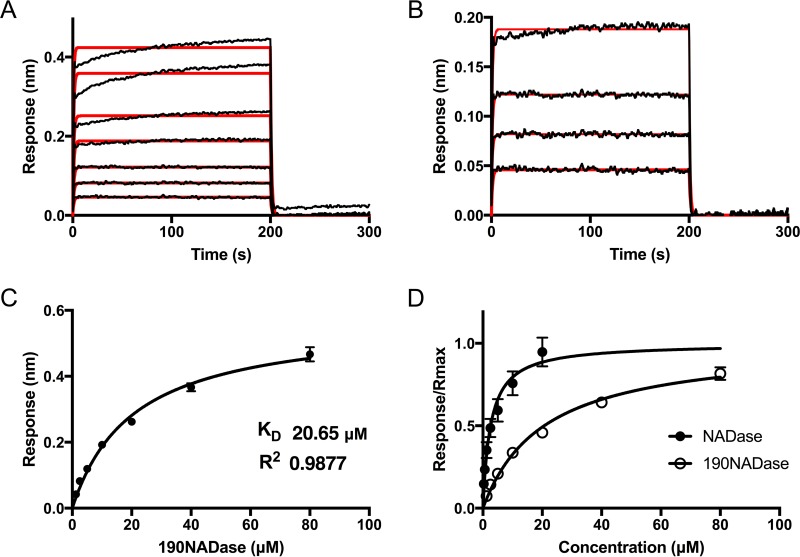
FIG 8 .
Kinetic analysis of 190NADase binding to SLO. SLO was immobilized on a biosensor tip, and the binding of 190NADase was assessed by BLI at incremental 2-fold increases in concentration. (A) Individual response curves are shown for 190NADase concentrations from 1.25 μM to 80 μM. The association and dissociation phases of the experiment are shown. The data fit a 1:1 binding model (red overlay) between 190NADase and SLO with a pattern suggestive of some nonspecific binding at the highest concentrations of 190NADase. (B) At concentrations of 1.25 to 10 μM 190NADase, a 1:1 binding model (red overlay) was in agreement with the data. (C) Steady-state analysis of the BLI response versus concentration of 190NADase yielded a KD of 20.65 ± 1.70 μM. (D) A comparison of saturation curves for NADase and 190NADase demonstrates higher affinity between SLO and full-length NADase than between SLO and the 190NADase catalytic domain. All experiments were repeated three times. Error bars represent standard deviations.

