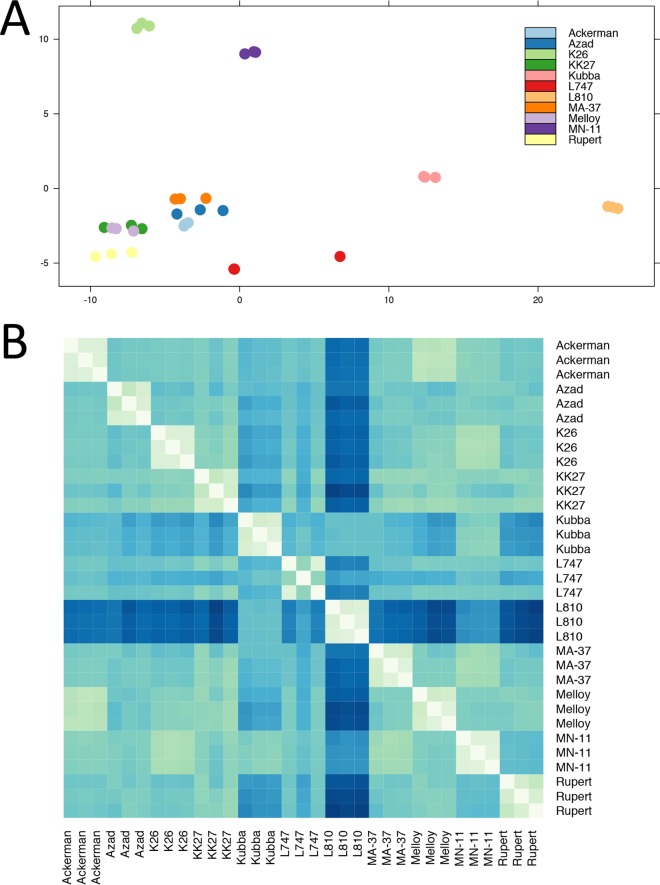
FIG 5 .
Isolate L810 (Israel) showed an aberrant expression signature compared to all other isolates. (A) PCA plot of expression data, showing the first two principal components on the x and y axes for all strains except Boone (one of the three replicates showed some characteristics of an outlier; see the main text). Each set of triplicates is represented in a different color, depending on the isolate of origin. Note the close clustering of each set of triplicates, indicating accurate biological replication. The replicates for isolate L810 clustered closely together, but quite distantly from the rest of the isolates. (B) Heat map of Euclidean distances between variance-stabilized expression values for each pair of samples, with larger Euclidean distances represented by darker shades of blue. Expression signatures within each set of triplicates were very similar to each other (represented in light colors along the diagonal axis). Isolate L810 showed an aberrant expression signature, with higher distance values in all pairwise comparisons (average distance values were closer to 50, instead of 33, as with the rest of the isolates).

