Figure 2.
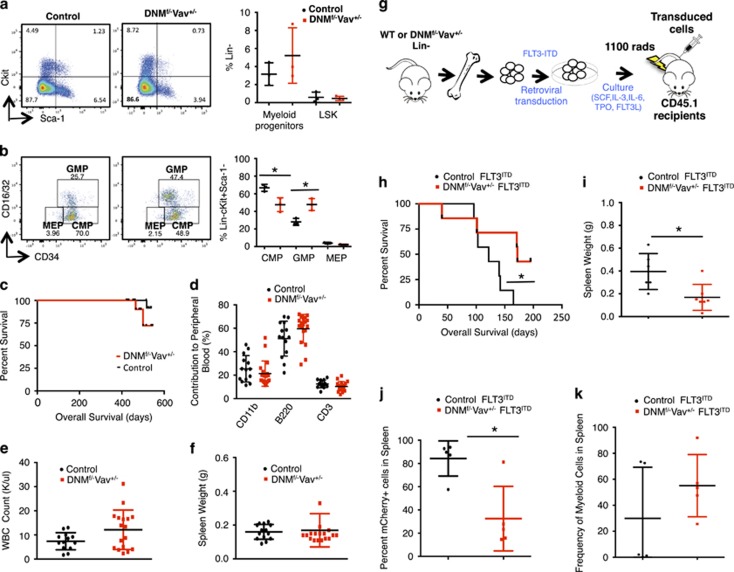
Long-term inhibition of Notch signaling expands the GMP compartment but does not produce highly penetrant myeloid neoplasms. (a) HSPC analysis of bone marrow cells harvested from DNMf/−Vav+/− and control mice killed at 15–18 months. Representative dot plots showing DNMf/−Vav+/− LSK cells and total myeloid progenitors. DNMf/−Vav+/− HSPCs were identified by first gating on the GFP+ fraction of Lin-negative cells, followed by Sca-1+cKit+ cells (LSK) or Sca-1-cKit+ cells (total myeloid progenitors). (b) DNMf/−Vav+/− myeloid progenitor subsets were identified by gating on the GFP+ fraction of Lin-negative cells, followed by cKit+Sca-1- and CD16/32 versus CD34: CMP (Lin-Sca-1-cKit+CD16/32−CD34+), GMP (Lin-Sca-1-cKit+CD16/32+CD34+) and megakaryocyte–erythroid progenitors (MEP) (Lin-Sca-1-cKit+CD16/32−CD34−). Representative dot plots of HSPC analyses are shown in Figures 2a and b (left panels) and the quantification of data from three mice are graphed (right panels). (c) Kaplan–Meier plot of the survival of DNMf/−Vav+/− (n=19) and control (n=15) mice aged to 15–18 months. (d) Flow cytometric analysis of lineage subsets (Myeloid, B- and T-cells) in peripheral blood taken from DNMf/−Vav+/− (n=19) and control (n=14) mice at 18 months. (e) Complete blood counts were also performed using peripheral blood collected from mice at 18 months in order to compare the total number of WBCs in DNMf/−Vav+/− (n=17) and control (n=13) mice. (f) At 15–18 months, mice were killed, spleens were harvested and spleen weights were compared in the graph: DNMf/−Vav+/− (n=18); controls (n=14). (g) Donor BM cells were harvested from DNMf/−Vav+/− or control mice at killing, Lin- cells were transduced with FLT3ITD MSCV-Ires-mCherry (MIC) construct and transplanted into CD45.1 recipients. (h) Kaplan–Meier plot of the survival of DNMf/−Vav+/− FLT3ITD (n=7) and control-FLT3ITD (n=7) mice. (i) Spleen weights of DNMf/−Vav+/−FLT3ITD(n=7) and control-FLT3ITD (n=6) mice. (j) Frequency of FLT3ITD cells in the spleens of mice was determined by assessing mCherry levels using flow cytometry. (k) Immunophenotype of splenocytes from DNMf/−Vav+/−FLT3ITD (n=5) mice compared to control-FLT3ITD (n=5) was determined by staining samples with myeloid lineage markers (CD11b, Gr-1) and analyzing samples with flow cytometry. Statistical significance was determined by a two-tailed, unpaired t-test (*P⩽0.05).

