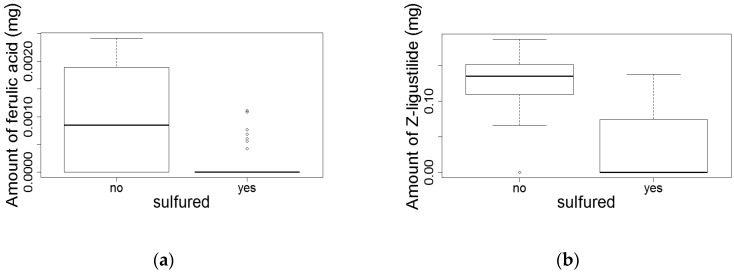
Figure 4.
Comparison of (a) ferulic acid and (b) Z-ligustilide levels between sulfured and unsulfured whole roots. Error bars represent the 95% confidential intervals (sulfured, n = 64; unsulfured, n = 24). Note: the HPTLC analysis for ferulic acid of sulfured roots yielded a majority of samples below the detection limit.

