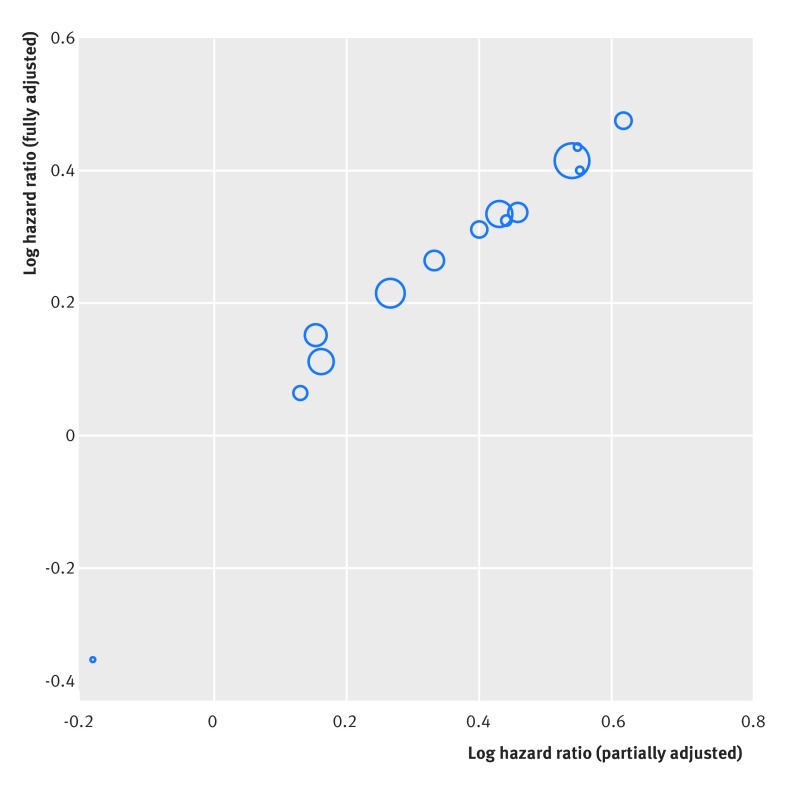
Fig 3 Strong observed correlation (linear association) between the log hazard ratio estimates of the partially and “fully” adjusted effect of fibrinogen on the rate of cardiovascular disease. The size of each circle is proportional to the precision (inverse of the variance) of the fully adjusted log hazard ratio estimate (ie, larger circles indicate more precise study estimates). Hazard ratios were derived in each study separately from a Cox regression, indicating the effect of a 1 g/L increase in fibrinogen levels on the rate of cardiovascular disease

An official website of the United States government
Here's how you know
Official websites use .gov
A
.gov website belongs to an official
government organization in the United States.
Secure .gov websites use HTTPS
A lock (
) or https:// means you've safely
connected to the .gov website. Share sensitive
information only on official, secure websites.
