Figure 3.
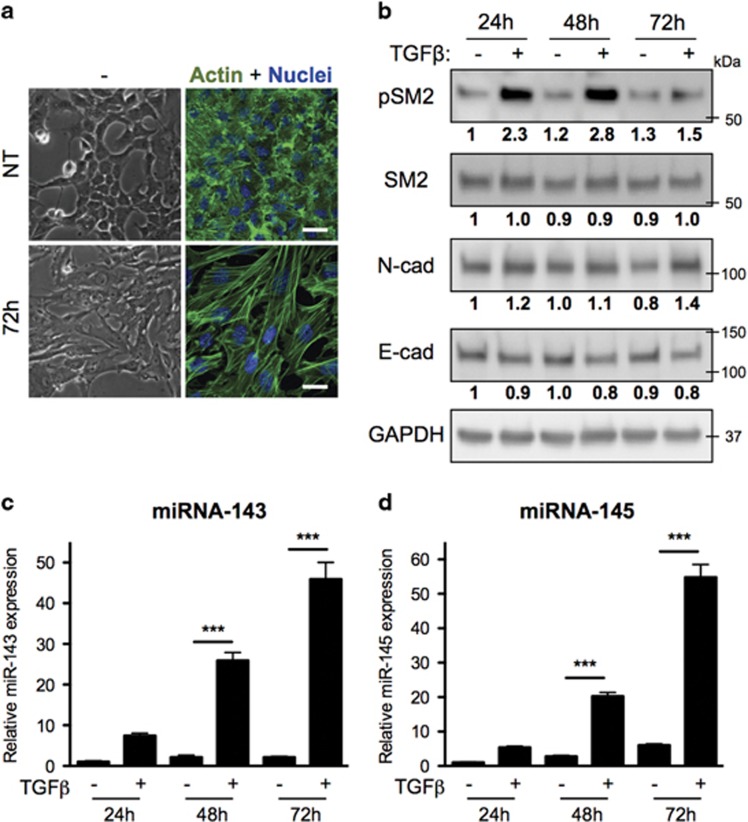
MiRs-143 and -145 are induced by TGF-β treatment. NMuMG cells either untreated (NT) or treated with TGF-β for the indicated times were analyzed as follows. (a) Phase contrast and IF (scale bar, 30 μm). (b) Western blot for phospho-SMAD2, SMAD2, N-cadherin and E-cadherin (numbers indicate signal intensity, normalized for loading and relative to the control sample). (c,d) qRT-PCR assessing miR-143 and miR-145 expression (mean±S.E.M. of expression values relative to untreated cells, n=3). P-value: ***P<0.001

