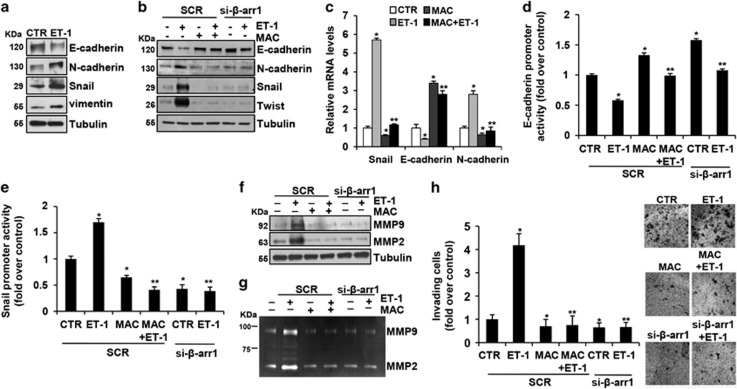
Figure 2.
ET-1R/β-arr1 axis drives EMT process in CRC-SC. (a) Lysates from CC09 cells were analyzed by IB for the expression of epithelial (E-cadherin) and mesenchymal (N-cadherin, Snail, and vimentin) markers after ET-1 (100 nM) stimulation for 24 h. Tubulin was used as loading control. (b) Lysates from CC09 cells transfected with SCR or si-β-arr1 and treated for 24 h with ET-1 (100 nM) and/or MAC (1 μM) were analyzed by IB for the expression of E-cadherin, N-cadherin Snail and Twist. Tubulin was used as loading control. (c) Snail, E-cadherin, and N-cadherin expression in CC09 cells upon ET-1 (100 nM) and/or MAC (1 μM) treatment evaluated by qPCR, normalized using endogenous cyclophilin-A. Values are shown as mean±S.D. from three independent experiments repeated in triplicates (*P<0.002 versus CTR; **P<0.005 versus ET-1). (d) E-cadherin promoter activity and Snail promoter activity (e) evaluated in CC09 cells transfected with SCR or si-β-arr1 and treated for 24 h with ET-1(100 nM) and/or MAC (1 μM). Values are shown as mean±S.D. from three independent experiments repeated in triplicates (*P<0.01 versus CTR; **P<0.001 versus ET-1 in SCR-transfected cells). (f) Lysates from CC09 cells transfected with SCR or si-β-arr1 treated with ET-1 (100 nM) and/or MAC (1 μM) for 24 h were analyzed for MMP-2 and -9 by IB. Tubulin was used as loading control. (g) Conditioned media collected from CCO9 treated as in (f) were used to determine the secretion and activity of MMP-2 and -9 by gelatin zymography. (h) Cell invasion assay of CC09 cells transfected with SCR or si-β-arr1 and exposed to ET-1 (100 nM) and/or MAC(1 μM) for 24 h. Values are shown as mean±S.D. from three independent experiments repeated in triplicates (*P<0.002 versus CTR; **P<0.001 versus ET-1 in SCR-transfected cells). Representative images of invading cells were shown in the right panel

