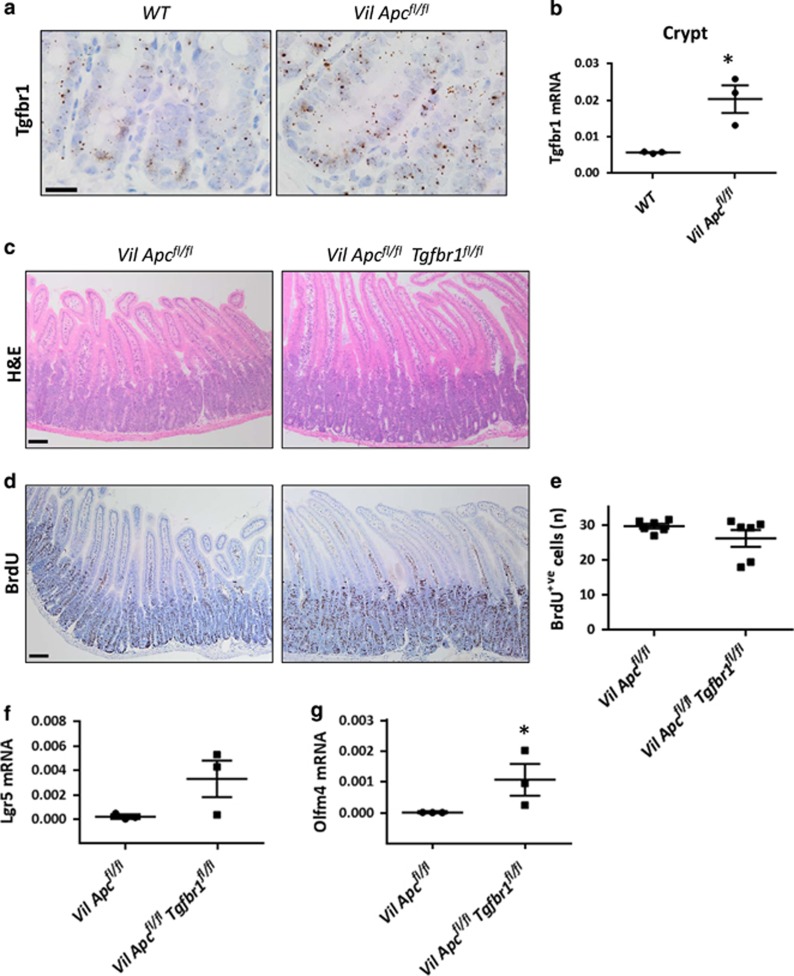
Figure 3.
Tgfbr1 is upregulated following Apc loss. (a) RNAscope of Tgfbr1 on wild-type (WT) and VilCreERApcfl/fl (Vil Apcfl/fl) crypts. Note the increased positivity following Apc loss. Scale bars, 20 μm. (b) Quantitative real-time-PCR (qRT-PCR) analysis of Tgfbr1 on WT and Vil Apcfl/fl crypts. Data are shown as ratios to the internal Gapdh control with error bars representing mean±S.E.M., *P=0.04 by Mann–Whitney test, one-tailed, n=3 biological replicates. (c) Haematoxylin and eosin (H&E) and (d) bromodeoxyuridine (BrdU) staining on Vil Apcfl/fl and VilCreERApcfl/flTgfbr1fl/fl (Vil Apcfl/flTgfbr1fl/fl) intestine 4 days post induction with tamoxifen. Scale bars, 100 μm. (e) Quantification of total BrdU+ cells of Vil Apcfl/fl and Vil Apcfl/fl Tgfbr1fl/fl intestine. Error bars represent mean±S.E.M., n=6 biological replicates. (f) qRT-PCR analysis of the stem cell markers Lgr5 and (g) Olfm4 on CDS generated from Vil Apcfl/fl and Vil Apcfl/flTgfbr1fl/fl small intestine. Data are shown as ratios to the internal Gapdh control with error bars representing mean±S.E.M., *P=0.04 by Mann–Whitney test, one-tailed, n=3 biological replicates

