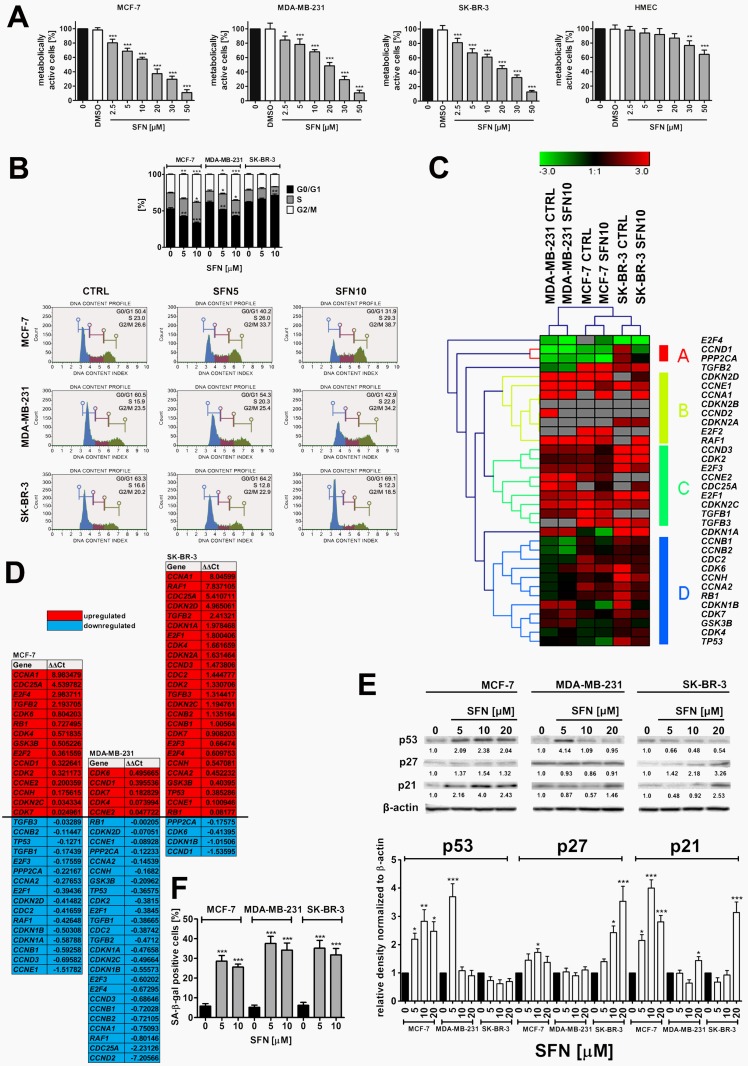
Figure 1.
SFN-induced cytotoxicity (A), changes in the cell cycle and cell cycle regulators (B, C, D, E) and stress-induced premature senescence (SIPS) (F) in breast cancer cells. (A) MTT test. Metabolic activity at control conditions is considered as 100%. The effect of solvent used (0.1% DMSO) is also shown. Bars indicate SD, n = 5, ***p < 0.001, **p < 0.01, *p < 0.05 compared to the control (ANOVA and Dunnett's a posteriori test). (B) DNA content-based analysis of cell cycle was conducted using flow cytometry and Muse™ Cell Cycle Kit. Bars indicate SD, n = 3, ***p < 0.001, **p < 0.01, *p < 0.05 compared to the control (ANOVA and Dunnett's a posteriori test). Representative histograms are also presented. (C, D) The expression profile of selected genes involved in the regulation of cell cycle. (C) A heat map generated from qRT-PCR data is shown. Hierarchical clustering was created using Genesis 1.7.7 software. (D) SFN-mediated upregulation (red) and downregulation (blue) of cell cycle genes. ΔΔCt values are shown. (E) Western blot analysis of the levels of p21, p27 and p53 cell cycle inhibitors. Anti-β-actin antibody was used as a loading control. The data represent the relative density normalized to β-actin. Bars indicate SD, n = 3, ***p < 0.001, **p < 0.01, *p < 0.05 compared to the control (ANOVA and Dunnett's a posteriori test). (F) Senescence-associated β-galactosidase (SA-β-gal) activity. Bars indicate SD, n=3, ***p < 0.001 compared to the control (ANOVA and Dunnett's a posteriori test). SFN, sulforaphane.

