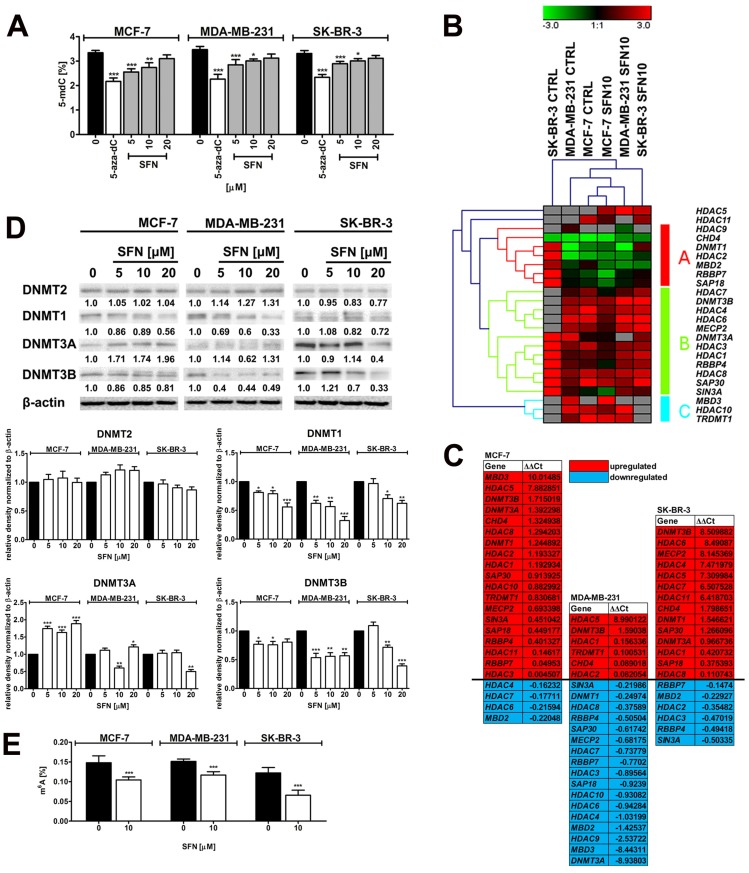
Figure 5.
SFN-mediated changes in global DNA methylation (A), the expression profile and mRNA levels of selected genes involved in DNA methylation and transcriptional repression (B, C), the levels of DNA methyltransferase proteins, namely DNMT1, DNMT2, DNMT3A and DNMT3B (D) and the levels of m6A RNA methylation (E) in breast cancer cells. (A) DNA methylation was estimated as a 5-methyl-2′-deoxycytidine (5-mdC) level using ELISA-based assay (Epigentek). Bars indicate SD, n = 3, *p < 0.05, **p < 0.01, ***p < 0.001 compared to the control (ANOVA and Dunnett's a posteriori test). Treatment with an inhibitor of DNA methylation 5-aza-2'-deoxycytidine (5-aza-dC) (5 µM, 24 h treatment) served as a negative control. (B, C) The expression profile of selected genes involved in DNA methylation and transcriptional repression. (B) A heat map generated from qRT-PCR data is shown. Hierarchical clustering was created using Genesis 1.7.7 software. (C) SFN-mediated upregulation (red) and downregulation (blue) of DNA methylation and transcriptional repression genes. ΔΔCt values are shown. (D) Western blot analysis of DNMT1, DNMT2, DNMT3A and DNMT3B levels. Anti-β-actin antibody was used as a loading control. The data represent the relative density normalized to β-actin. Bars indicate SD, n = 3, ***p < 0.001, **p < 0.01, *p < 0.05 compared to the control (ANOVA and Dunnett's a posteriori test). (E) The levels of N6-methyladenosine (m6A) in RNA samples were measured using EpiQuik m6A RNA Methylation Quantification Kit. Bars indicate SD, n=3, ***p < 0.001 compared to the control (ANOVA and Dunnett's a posteriori test). SFN, sulforaphane.

