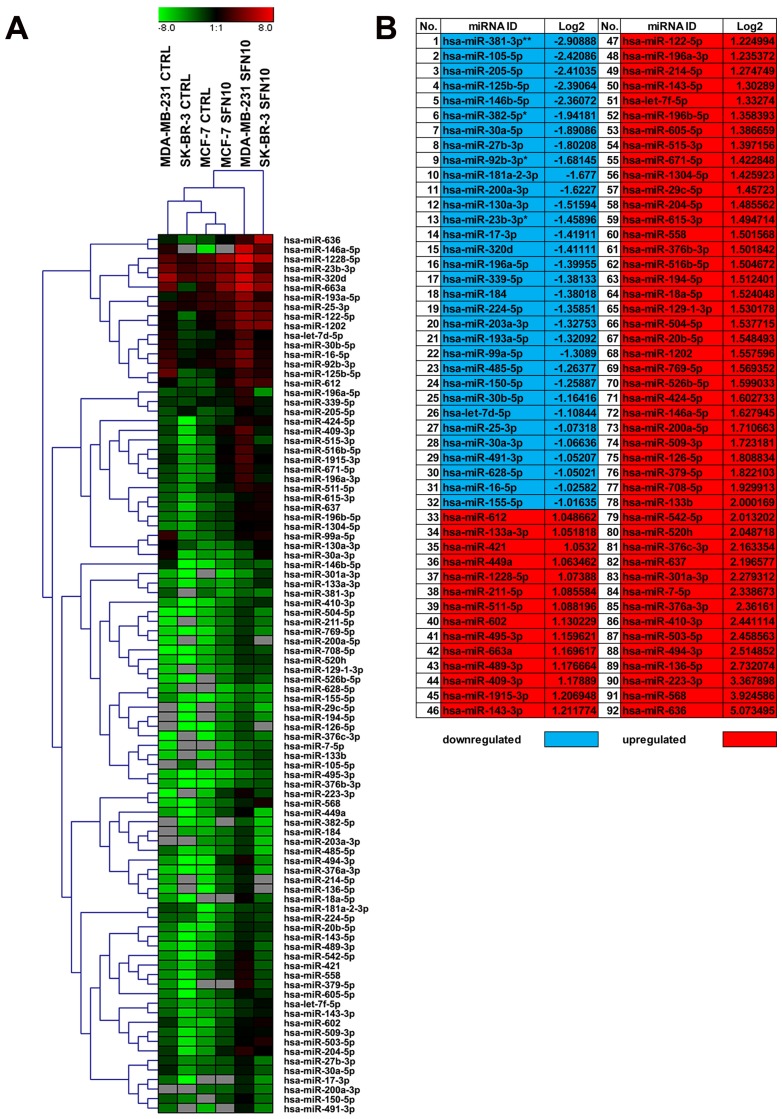
Figure 6.
SFN-mediated changes in microRNA profile in breast cancer cells. The expression of 352 microRNAs (http://www.bioline.com/list-of-cancer-panel-plates#tab2) was evaluated using EPIK Cancer miRNA Panel. (A) A heat map generated from qRT-PCR data is shown. Hierarchical clustering was created using Genesis 1.7.7 software. (B) SFN-mediated upregulation (red) and downregulation (blue) of selected microRNAs in three breast cancer cells. Log2 values are shown; *p < 0.05, **p < 0.01 compared to the control (Student's t-test). SFN, sulforaphane.

