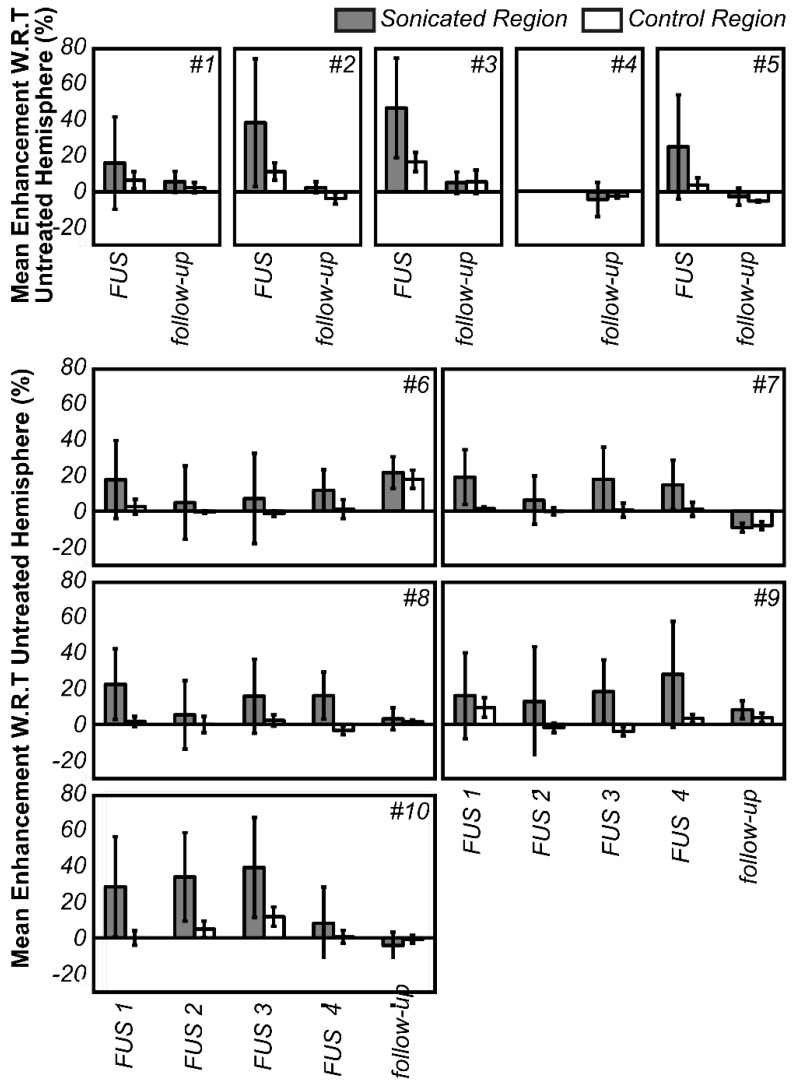
Fig 5.
Mean enhancement of the treated hemisphere with respect to the contralateral hemisphere for all animals, expressed as (1-mean_intensitytreated/mean_intensityuntreated)*100%. The enhancement values are averaged over the entire hemisphere. A control (unsonicated) region in the treated hemisphere is also shown (compared to the same contralateral, untreated region) to eliminate bias from spatial sensitivity of the MRI coil. The error bars indicate one standard deviation.

