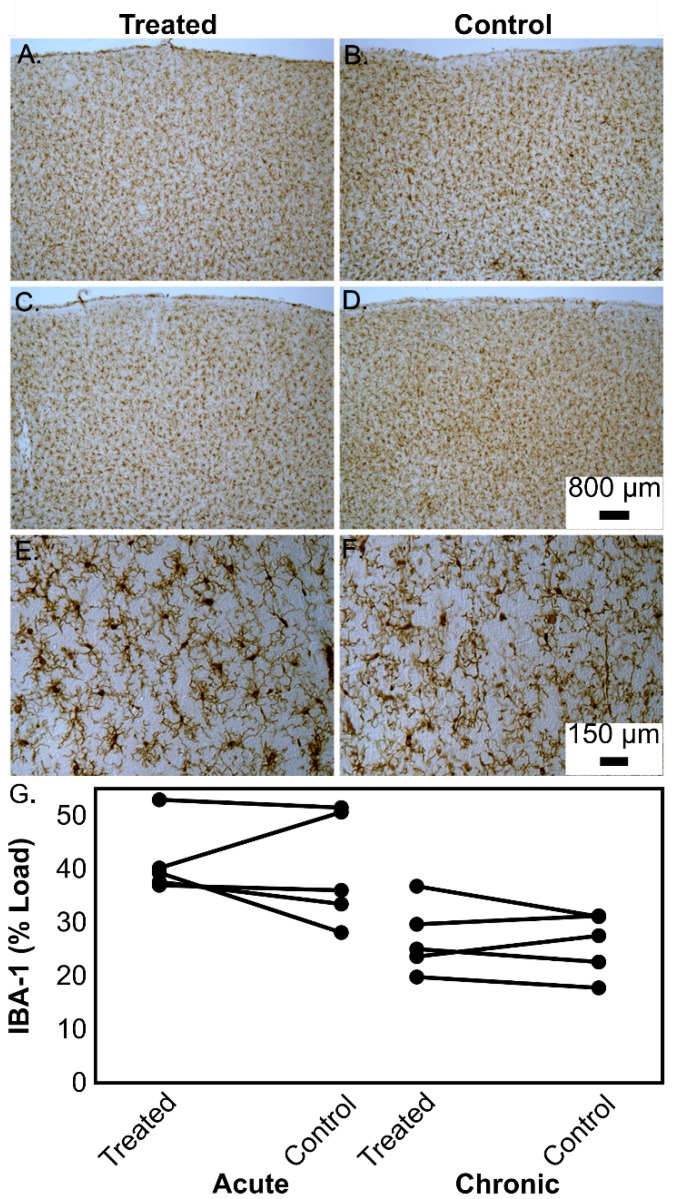
Fig 7.
Representative examples of microglial (IBA-1) immunostaining in the prefrontal cortex of aged beagles in response to treatment. In a single treatment, the left treated hemisphere shows similar microglial “loads” (A) to the right untreated hemisphere (B). Similarly, the left hemisphere of a dog given 4 treatments (C) shows similar microglial “loads” to the right untreated hemisphere (D). Panels A-D all have the same magnification and the scale bar is 800 μm. Higher magnification (scale bar 150 μm) of sections from a dog given 4 treatments highlights the morphology of the microglial cells in the left prefrontal cortex (E) as compared to the right prefrontal cortex (F). The quantification of the microglial loads is shown in panel (G) for the acute and chronic treatment groups.

