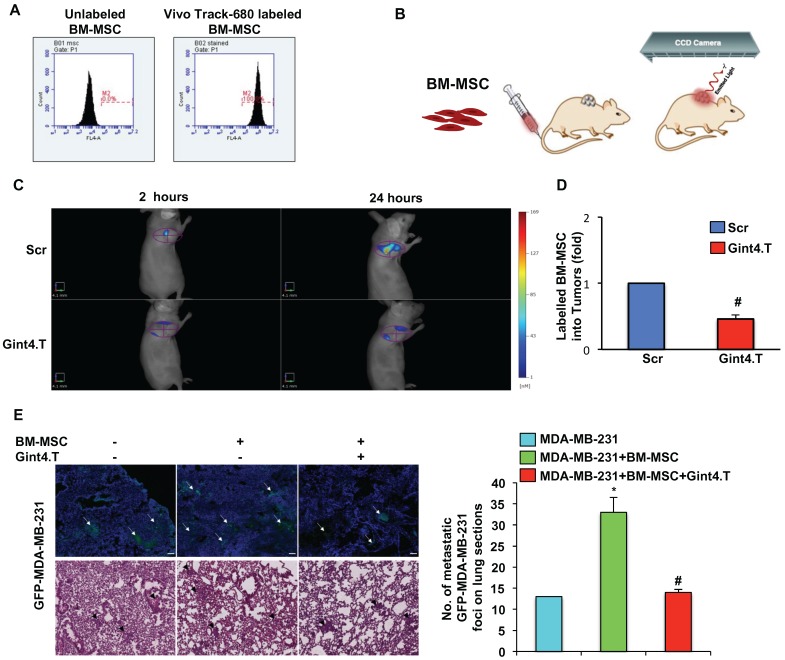
Figure 5.
Representative images of BM-MSC recruitment into TNBC xenografts by fluorescence tomography and BM-MSCs pro-metastatic activity. (A) BM-MSCs were incubated with VivoTrack 680 for 30 minutes and the dye uptake was analyzed by flow cytometry. (B-C) Nude mice bearing MDA-MB-231 xenografts were i.v. injected with VivoTrack 680-labeled BM-MSCs treated with Gint4.T or Scr aptamer and analyzed with FMT. (D) FACS analysis of NIR labeled BM-MSCs in cell suspension from tumors (#P < 0.01, compared to Scr aptamer). (E) Representative fluorescence (upper panels) and H&E (lower panels) images of lung sections from mice injected with MDA-MB-231/GFP cells alone or mixed with BM-MSCs, left untreated or treated with Gint4.T for 3 hours prior to injection. Multifocal metastatic lesions expressing GFP or H&E-stained are indicated by white and black arrows, respectively. Nuclei were stained with DAPI. All images had a magnification of 5.41x from the initial slide scan. Scale bar = 100 μm. Metastatic foci in lung sections were counted on at least 5 random fields per section (n = 3 mice, *P < 0.01 compared to MDA-MB-231/GFP; #P < 0.01 compared to MDA-MB-231/GFP +BM-MSCs).

