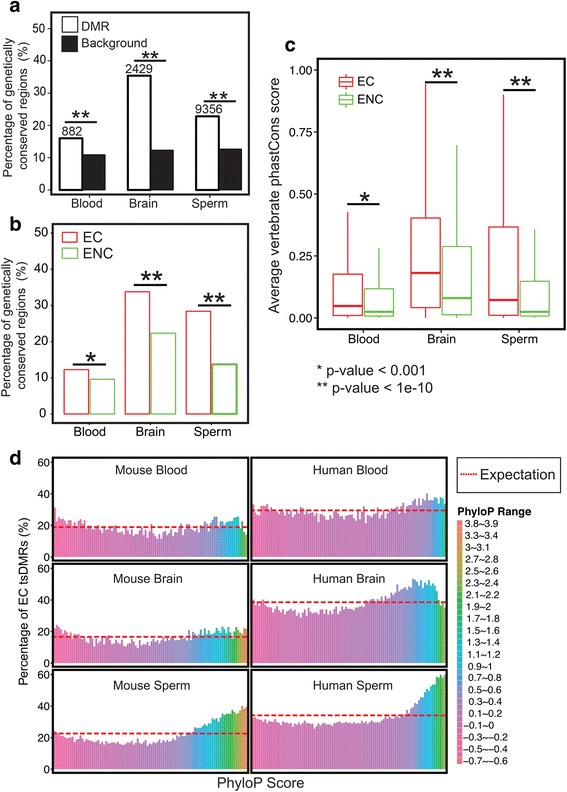
Fig. 3.

Epigenetically conserved tsDMRs and epigenetically non-conserved tsDMRs show distinct genetic conservation. a Percentage of rat tsDMRs that are genetically conserved. A pre-defined list of rat-conserved elements was determined using the Hidden Markov model from the UCSC Genome Browser. A rat tsDMR was defined as “genetically conserved” if at least 20% of the rat tsDMR region overlapped with genetically conserved elements (Methods). The number of genetically conserved tsDMRs is indicated above the bars for each tissue type. For each tissue type, a genomic annotation matched random control set was chosen. A chi-square test was performed to obtain p-values. P-values were corrected for multiple testing using the Benjamini–Hochberg FDR method. b Percentage of EC rat tsDMRs mapped in mouse that overlap with genetically conserved rat elements (in red) and the percentage of ENC rat tsDMRs mapped in mouse that overlap with genetically conserved rat elements (in green). A chi-square test was performed to obtain the p-values. P-values were corrected for multiple testing using the Benjamini–Hochberg FDR method. c Distribution of phastCons scores of EC rat tsDMRs and ENC rat tsDMRs in mouse. A Wilcoxon test was performed to obtain p-values. P-values were corrected for multiple testing using the Benjamini–Hochberg FDR method. d Epigenetic conservation (Y-axis) and genetic conservation as defined by PhyloP scores (X-axis) (Methods)
