
Fig. 3.
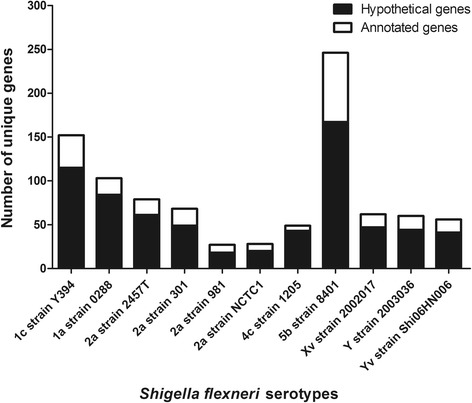
Distribution of unique genes found in the S. flexneri genomes. The X-axis is the S. flexneri serotypes, and Y-axis denotes the corresponding number of unique genes. The number of unique hypothetical genes within a genome is shaded black
Official websites use .gov
A
.gov website belongs to an official
government organization in the United States.
Secure .gov websites use HTTPS
A lock (
) or https:// means you've safely
connected to the .gov website. Share sensitive
information only on official, secure websites.
Distribution of unique genes found in the S. flexneri genomes. The X-axis is the S. flexneri serotypes, and Y-axis denotes the corresponding number of unique genes. The number of unique hypothetical genes within a genome is shaded black