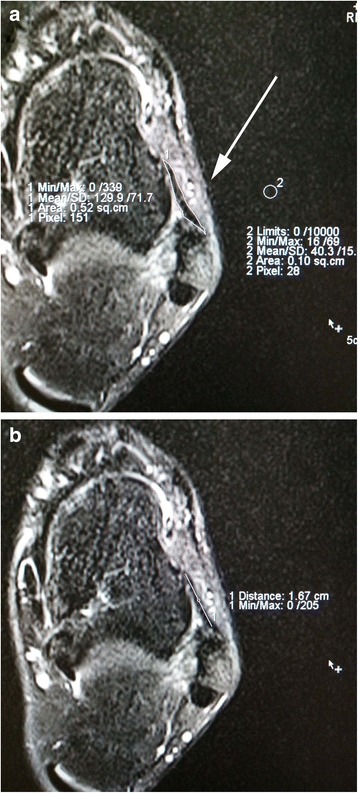
Fig. 1.

Analysis of anterior talofibular ligament (ATFL) dimension and signal intensity (SI) on axial MRI image. (1) The signal intensity (SI) was calculated at the ATFL site as well as the background site (approximately 2 cm near to the ATFL) using a region of interest (ROI). The signal/noise ratio (SNR) was calculated using the following equation: SNR = signal of ATFL / signal of background. The area of the ATFL ligament was directly measured by drawing the contour of ATFL. (2) The length of the ATFL. The ATFL was lined extending from the anterior and inferior borders of the fibula to the neck of the talus
