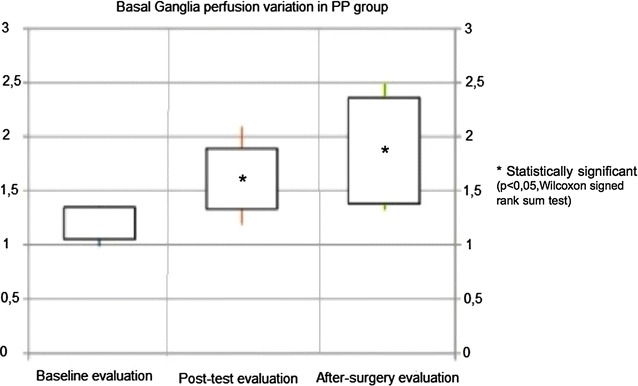
Fig. 3.

Basal ganglia perfusion changes in positive patients (PP). On the vertical axis relative perfusion values are reported [mean rCBF Basal Ganglia/mean rCBF Occipital]. Rectangles represent data inter-quartile range (IQR) and straight lines represent standard deviation (SD). Data are represented for baseline evaluation, after test evaluation and post-surgery assessment
