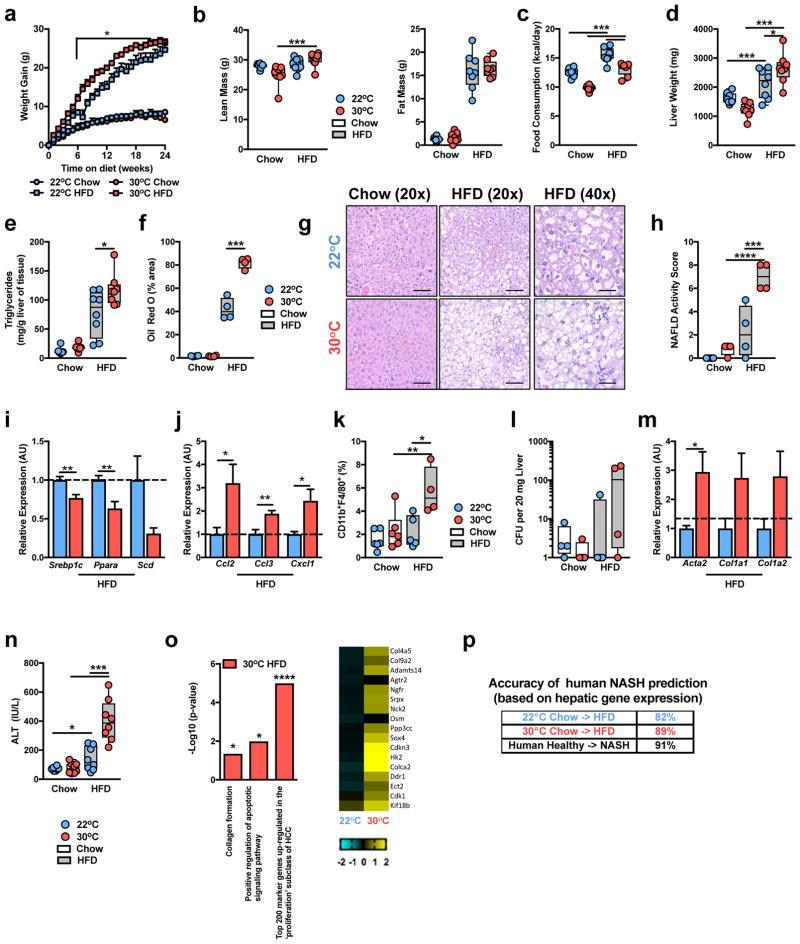
Figure 2.
Thermoneutral housing exacerbates HFD-driven NAFLD pathogenesis. (a–o) 6 week-old WT C57BL/6 male mice were housed at TS (22°C) or TN (30°C) for 24 weeks and fed a chow or HFD. (a) Weight gain. (b) Total body lean and fat mass. (c) Daily caloric intake. (d) Liver weight. (e) Hepatic triglyceride levels (a-e; n = 8 per group). (f) Oil red O staining, percent area positive for lipid accumulation. (g) Representative liver histology (n = 4 per group) by H&E staining at 20x and 40x magnification. Scale bars, 100μm (left and middle) and 50μm (right). (h) NAFLD activity score. (i) Expression of the indicated lipid mediator genes in the liver. (j) Expression of the indicated chemokine genes in the liver. (k) Percent of hepatic CD11b+F4/80+ immune cells. (l) Colony forming units (CFU) of aerobic bacteria cultured from liver homogenate. (m) Expression of the indicated fibrosis marker genes in the liver (f–m; n = 4 per group). (n) Serum alanine transaminase (ALT) levels (n = 8 per group). (o) Upregulated gene expression pathways, and genes within pathways, determined by RNASeq analysis of livers from HFD-fed mice (n = 2 per group). (p) Predictability of human NASH based on simple machine vector learning technique. Blue denotes TS (22°C); Red denotes TN (30°C). Data represents mean + s.e.m. (a–n) A representative of 5 individual experiments. (o and p) A single experiment. *P < 0.05, **P < 0.01, ***P < 0.001, ****P < 0.0001. (a–f, h, k, l and n) One way ANOVA with post hoc Tukey’s test. (i, j and m) Student’s t-test.

