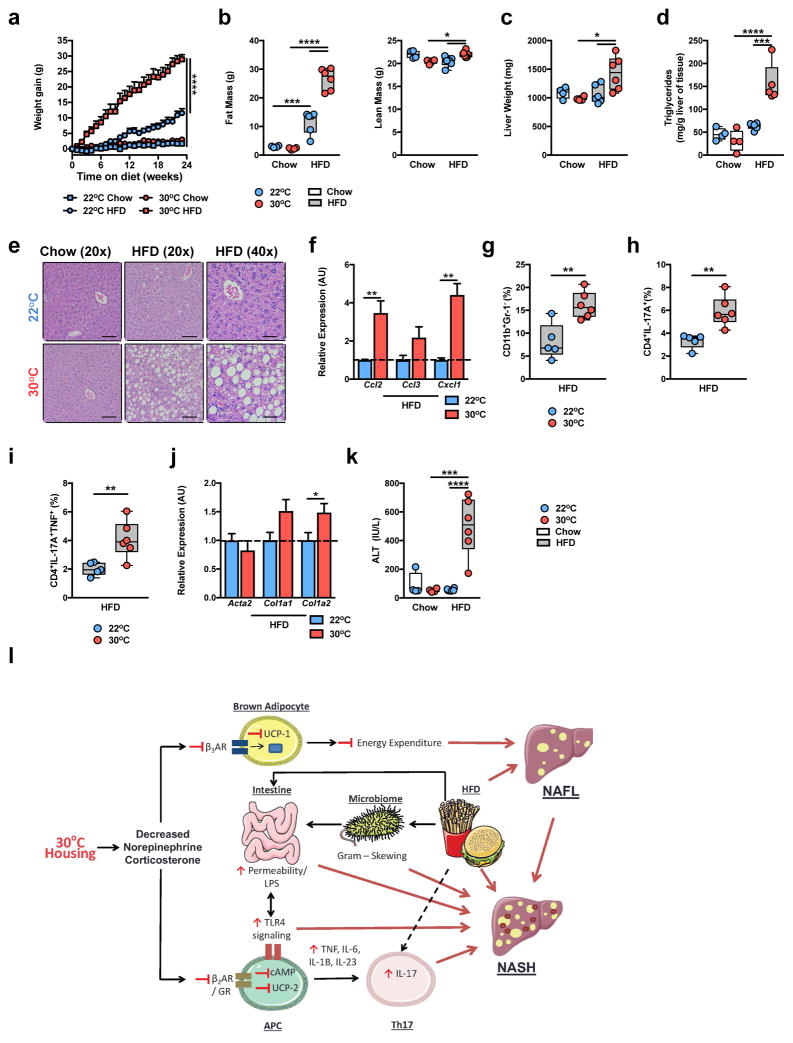
Figure 6.
Thermoneutral housing removes the barrier to modeling obesity and NAFLD in female mice. (a–k) 6 week-old WT C57BL/6 female mice housed at TS (22°C) fed chow (n = 4 per group) or HFD (n = 6 per group) or housed at TN (30°C) and fed chow (n = 4 per group) or HFD (n = 6 per group) for 24 weeks. (a) Weight gain. (b) Total body fat mass and lean mass. (c) Liver weight. (d) Hepatic triglyceride levels. (e) Representative liver histology (n = 4 per group) by H&E staining at 20x and 40x magnification. Scale bars, 100μm (left and middle) and 50μm (right). (f) Expression of the indicated chemokine genes in the liver of HFD fed mice. (g) Percent of hepatic infiltrating CD11b+GR-1− immune cells in HFD fed mice. (h) Percent of hepatic infiltrating Th17 cells in total hepatic immune cell infiltrate in HFD fed mice. (i) Percent of hepatic infiltrating Th17 cells also producing TNF in total hepatic immune cell infiltrate in HFD fed mice. (j) Expression of the indicated fibrosis marker genes in the liver in HFD fed mice. (k) Serum ALT levels in chow and HFD fed mice. (l) Schematic diagram depicting the role of TN housing in promoting exacerbated NAFLD pathogenesis during HFD feeding where red lines represent factors associated with exacerbated NAFLD at TN (APC – Antigen presenting cells; NAFL – Nonalcoholic Fatty Liver). This schematic, in part, is composed by available artwork (http://www.servier.com/Powerpoint-image-bank), per licensing agreement (https://creativecommons.org/licenses/by/3.0/legalcode). For bar graphs, data represents mean + s.e.m. (a–k) A representative of 3 individual experiments. *P < 0.05, **P < 0.01, ***P < 0.001, ****P < 0.0001. (a–d and k) one way ANOVA with post hoc Tukey’s test. (f–j) Student’s t-test.

