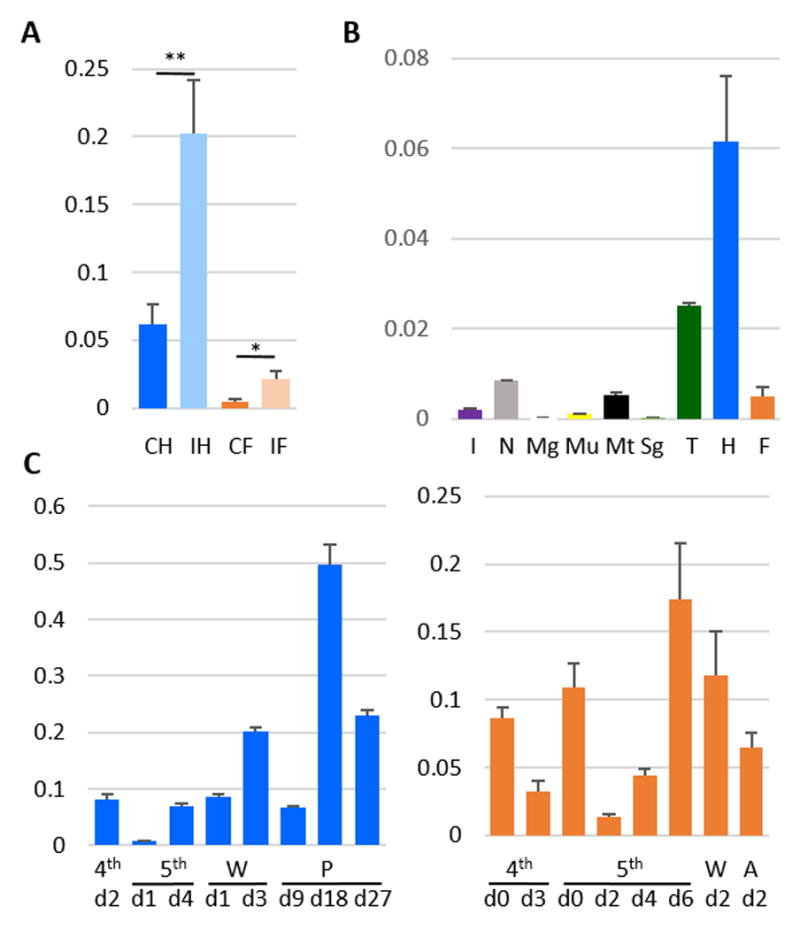
Figure 2. qRT-PCR Measurement of M. sexta SRP2 mRNA Levels. (A).

Immune inducibility. As described in Materials and methods, the total RNA samples of control and induced hemocytes (CH and IH) and fat body (CF and IF) were reverse transcribed to cDNA and analyzed by quantitative real-time PCR using the SRP2-specific primers. The relative mRNA levels normalized with rpS3 based on their Ct values in three biological replicates (3 larvae per sample) and plotted as a bar graph (mean ± SD, n = 3). The statistical significances were calculated using the Student’s t-test and significant increases are shown as * (p<0.05) and ** (p<0.01). (B) Tissue specificity. RNA samples of integument (I), nerve tissue (N), midgut (Mg), muscle (Mu), Malpighian tubule (Mt), salivary gland (Sg), trachea (T), hemocytes (H), and fat body (F) from day 3, fifth instar naïve larvae were prepared and analyzed by qPCR under the same conditions. (C) Developmental profiles. The mRNA levels in hemocytes (left) and fat body (right) at different life stages were determined using the same method. W, wandering; P, pupal; A, adult.
