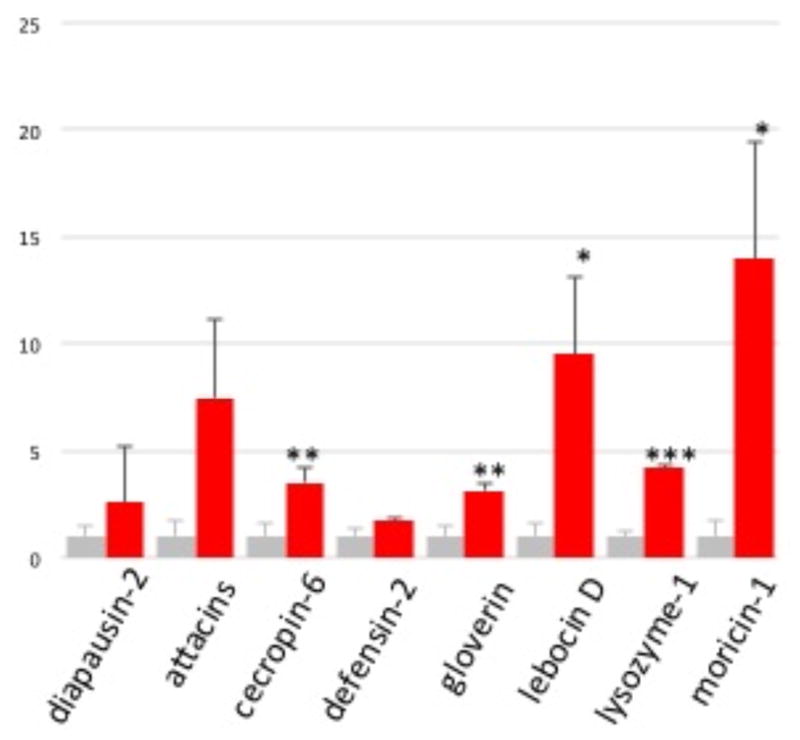
Figure 3. Induction of AMP Expression by Injection of PBS (grey) or SRP2 (red).

As described in Materials and methods, the test and control total RNA samples of fat body from the larvae injected with buffer on peptide were analyzed by qPCR using the primers specific for eight AMP genes. After normalization against rpS3, the average SRP2 mRNA levels in the control samples were adjusted to one, and relative levels in the SRP2 injected group were calculated accordingly. The statistical significances were calculated using the Student’s t-test and significant increases are shown as * (p<0.05), ** (p<0.01), or *** (p<0.001).
