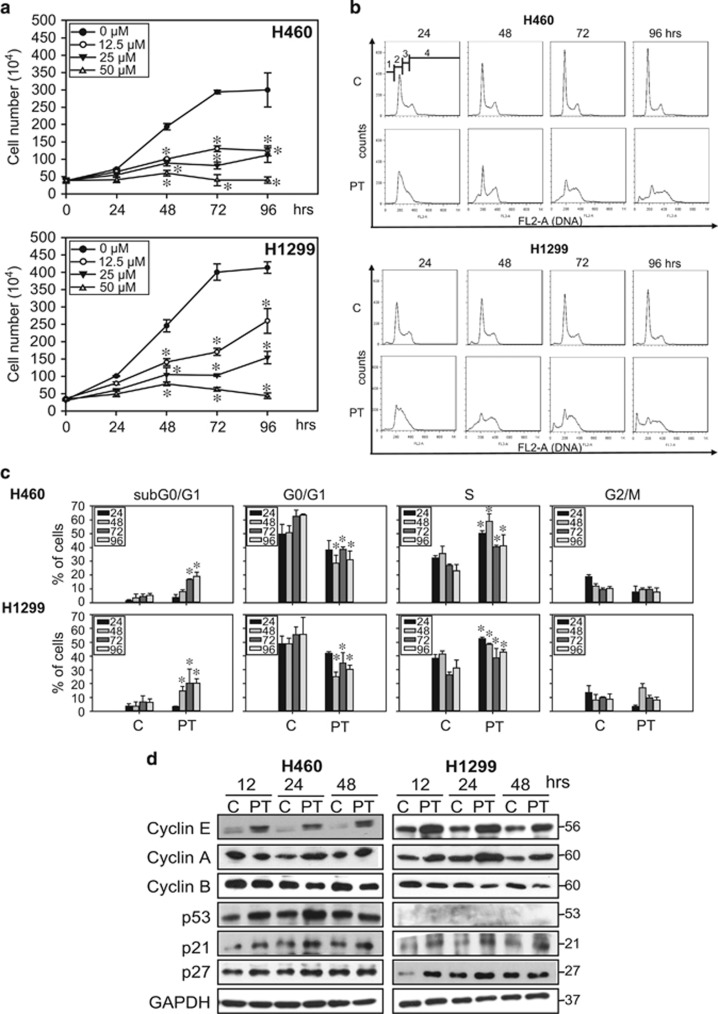
Figure 1.
Effects of PT on the growth inhibition and cell cycle arrest in lung cancer cells. (a) H460 and H11299 lung cancer cells were plated in six-well plates for 24 h and then treated with different concentrations of PT (0, 12.5, 25 and 50 μM) for 24, 48, 72 and 96 h. Cell numbers were counted daily by Trypan blue exclusion assay. Data represented the mean±S.E.M. of three independent experiments. *P<0.05 compared with the control group (0 μM). (b) H460 and H1299 were seeded in six-well plates and treated with 50 μM PT for the indicated times (24, 48, 72 and 96 h). Cells were collected and incubated with 40 μg/ml of PI for 15 min and subjected to flow cytometry analysis to examine the cell distribution at each phase of the cell cycle. Data are presented as representative graphs from three independent experiments. sub-G0/G1, G0/G1, S and G2/M phases are indicated as 1, 2, 3 and 4, respectively. (c) The percentage of cells in cell cycle phase was determined using FlowJo 7.6.1 software. Data represent the mean±S.E.M. (n=3, *P<0.05 compared with the control (d) H460 (left panel) and H1299 cells (right panel) were treated with 50 μM PT for indicated times then cell lysates were isolated and immunoblotted with anti-cyclin E, cyclin A, cyclin B, p53, p21 and p27 antibodies. Membranes were probed with an anti-GAPDH antibody to confirm equal loading of proteins. Representative data from one of three independent experiments are shown

