Figure 2.
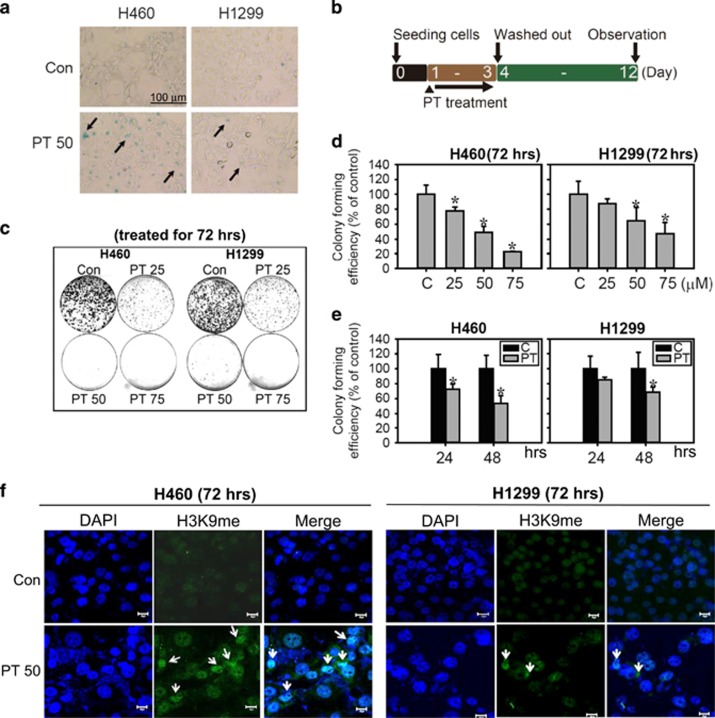
PT-induced senescence in lung cancer cells. Senescence morphology of H460 and H1299 cells treated with 50 μM PT for 48 h. Cells were stained for β-gal. The representative images are shown with arrows indicating senescent morphology (a), bar: 100 μm. The experiment scheme for measuring loss of replication and regenerative potential (RP) was presented in (b). Cells were seeding overnight and then treated with or without 50 μM PT for 72 h. PT was then removed and cells could recover for additional 9 days (total period of 12 days). Then, colonies were stained with crystal violet (c). (d) Lung cancer cells were treated with 25, 50 or 75 μM PT for 72 h then PT was removed and the cells were allowed to recover for additional 9 days. (e) The colony-forming efficiency was also examined in lung cancer cells treated with 50 μM PT for 24 and 48 h and then cultivated in drug-free medium for additional 9 days. Data represent the mean±S.E.M. (n=3, *P<0.05 compared with the control). Y axis represents % decreases in the number of colonies relative to control. (f) Immunofluorescence analysis of the senescent heterochromatin foci stained with H3K9me3 (green) and with DAPI (blue) to visualize DNA in H460 and H1299 cells treated with PT (50 μM) for 72 h (Bar: 20 μm)

