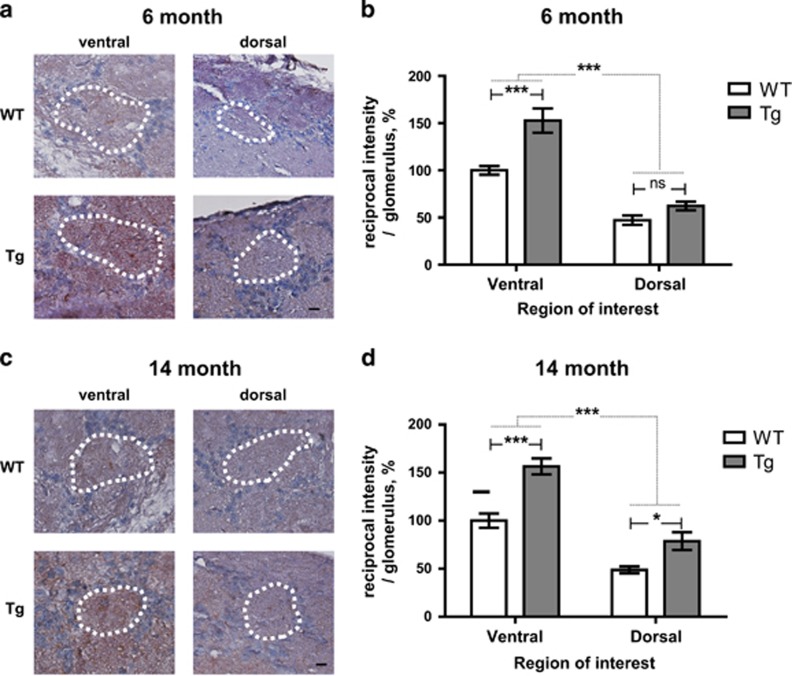
Figure 3.
The intensity of the Aβ oligomer is increased in certain region OB of Tg2576 mice compared with age-matched WT mice. (a and c) Evolution of the Aβ oligomer in WT versus Tg in 6-month-old (WT, n=7; Tg, n=7) (a) and 14-month-old (WT, n=9; Tg, n=8) (c). (b and d) Stereological analysis of the Aβ oligomer intensity (WT control in each group) in 6-month-old (b) and 14-month-old (d) mice. All data are presented as mean±S.E.M. Scale bar=10 μm. Two-way ANOVA, using Prism software (GraphPad software), *P<0.05 and ***P<0.001 denote statistical significance

