Figure 4.
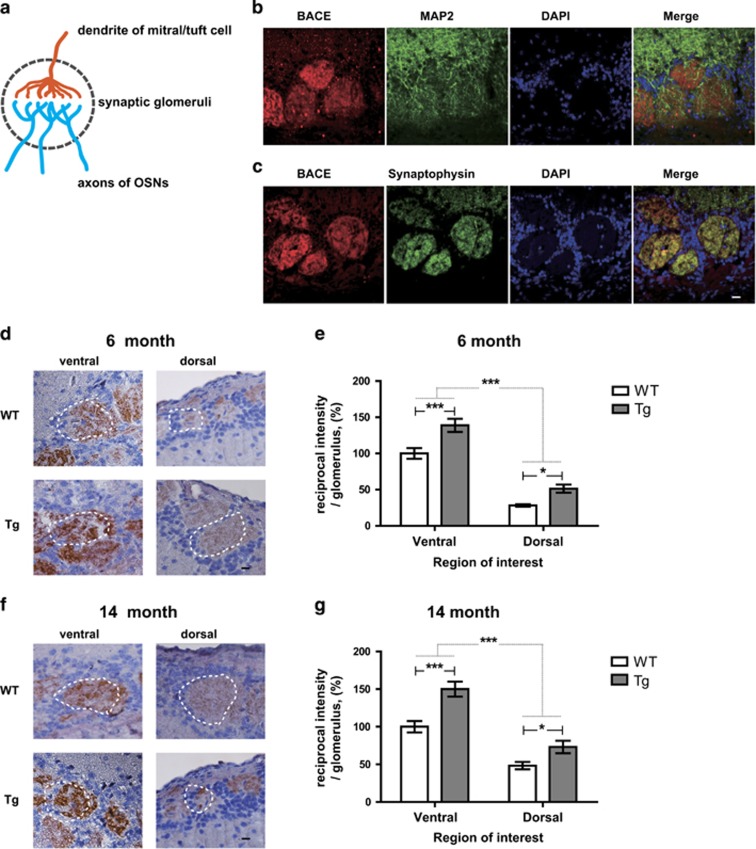
BACE1 is localized within presynaptic terminals and the intensity of the BACE1 is increased in certain region OB of Tg2576 mice compared with age-matched WT mice. (a) Illustration of coronal sections through the single glomerulus with presynaptic terminal of OSNs and postsynaptic region of mitral/tuft cells. (b and c) Representative images of coronal glomerulus sections from WT versus Tg in 6-month-old (Tg, n=4). Co-stained with BACE1 (red) and MAP2 (b) or synaptophysin (c) (green) antibodies and imaged by confocal microscopy. BACE1 immunoreactivity and synaptophysin signals significantly co-localize within OSN terminals, but BACE1 expression does not overlap with that of the somatodendritic marker MAP2 (green) within the glomerulus across all the condition while different signal intensity. Scale bar=10 μm. (d and f) Evolution of the BACE1 in WT versus Tg in 6-month-old (WT, n=7; Tg, n=7) (d) and 14-month-old (WT, n=9; Tg, n=8) (f). (e and g) Stereological analysis of the BACE1 intensity (WT control in each group) in 6-month-old (e) and 14-month-old (g) mice. All data are presented as mean±S.E.M. Scale bar=10 μm. Two-way ANOVA, using Prism software (GraphPad software), *P<0.05 and ***P<0.001 denote statistical significance

