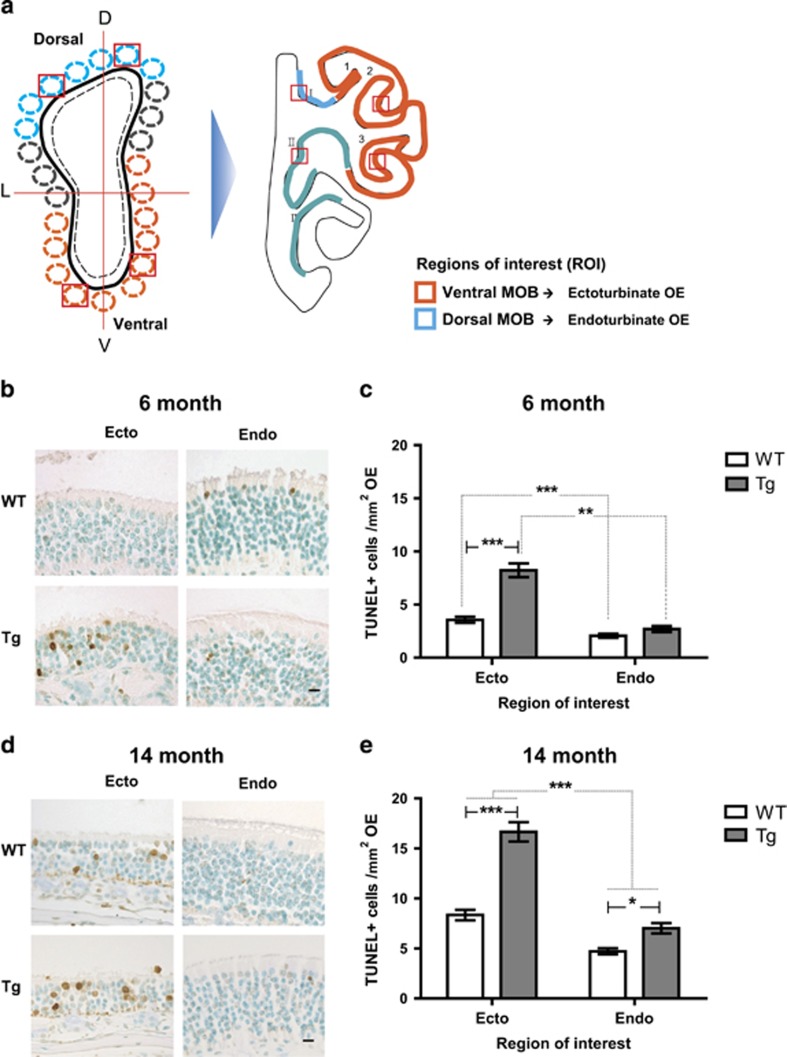
Figure 5.
Specific region of OE shows massive cell death in Tg2576 mice. (a) Illustration of coronal sections through the OB and OE with region of interest. Depictions represent predetermined glomeruli in the OB and corresponding OE with region of interest. Blue outline shading denotes the dorsal MOB and orange outline shading denotes the ventral MOB. Blue outline shading denotes the endoturbinate OE and orange outline shading denotes the ectoturbinate OE. (b and d) Images of TUNEL staining (brown signal) in the ectoturbinate, and endoturbinate of the OE in (b) 6-month-old and (d) 14-month-old WT versus Tg mice. Methyl green was counterstained (sky blue signal). Scale bars represent 10 μm. (c and e) Stereological analysis of the incidence of TUNEL-positive cells (TUNEL-positive cells/mm2 OE in each group) in the OE of 6-month-old (c) (WT, n=7; Tg, n=7) and 14-month-old mice (e) (WT, n=9; Tg; n=8). All data are presented as mean±S.E.M. Two-way ANOVA, using Prism software (GraphPad software), *P<0.05 and ***P<0.001 denote statistical significance

