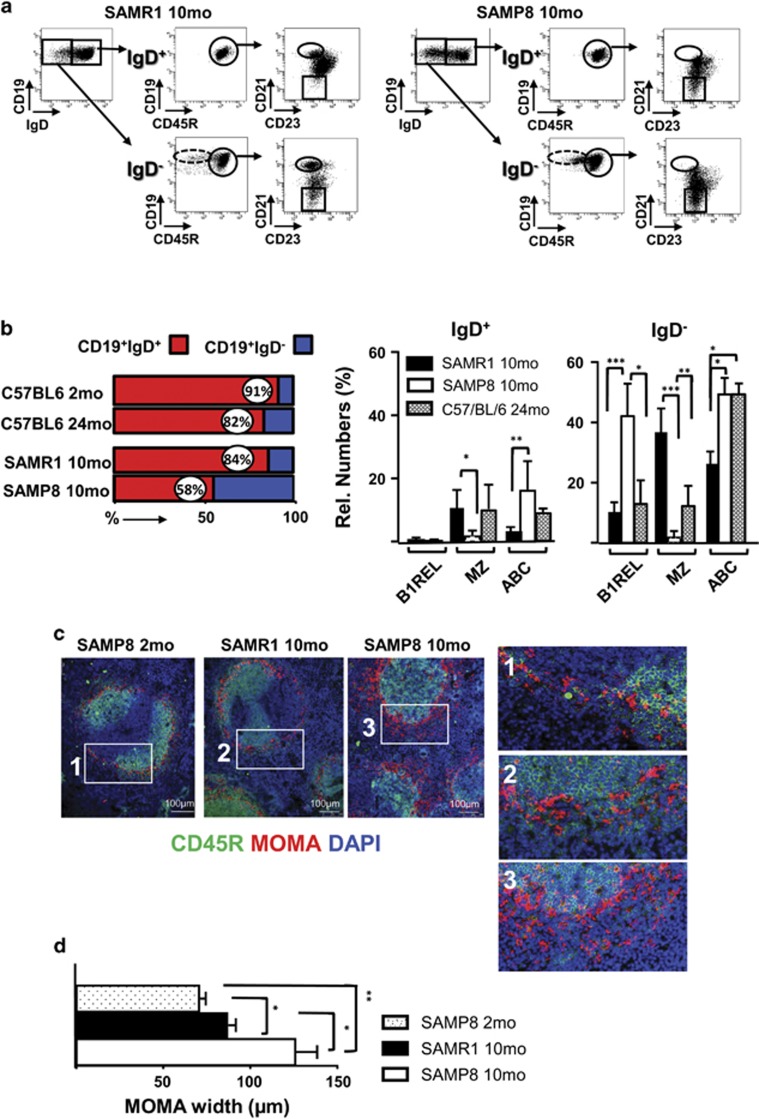
Figure 2.
Phenotypic features of B lymphocytes and primary follicle organization in spleens from SAMP8 mice. The phenotype of the B1REL, B2, MZ and ABC B-cell subsets identified in the spleen of 10-month-old SAMR1 and SAMP8 mice, and the follicle distribution found in 2- and 10-month-old SAMP8 and SAMR1 mice, are shown. (a) Flow cytometry analyses were performed on spleen samples stained as in Figure 1b and with anti-IgD-FITC. Shown are representative dot-plots of the staining obtained from 10-month-old SAMR1 and SAMP8 samples. The left plot in each case, shows the distribution of IgD expression on gated CD19+ cells, identifying CD19+IgD+ and CD19+IgD− subpopulations. The gates drawn inside the middle and right plots define, as in Figure 1b, the B1REL, B2,MZ and ABC cell subsets obtained from IgD+ cells (upper plots) and IgD− cells (bottom plots). Fluorescence scales are logarithmic. (b) Left, the bar graph shows the distribution (as percentage of CD19+ cells) of IgD+ (red) and IgD− (blue) cell subsets on 10-month SAMR1 (R1), and SAMP8 (P8) mice and on 24-month C57BL/6. Right column graphs, quantification of the indicated cell subsets as percentages of CD19+IgD+ and CD19+IgD−cells. Data are the mean±S.E.M. (n=7).Comparisons were made with a two-tailed Student’s t-test: *P<0.05; **P<0.01; ***P<0.001. (c) Immunofluorescence studies on splenic sections from the indicated samples. Three-color staining was performed using biotinylated MOMA-1 revealed with Cy3-tyramide (red), Cy5-labeled CD45R (green) and DAPI (blue). Brightness and contrast were adjusted using Photoshop version 7.0 (Adobe Systems Inc., San Jose, CA, USA) for display. Representative photomicrographs from each strain are shown. The boxes drawn in white define the regions amplified in the right, showing the MOMA band around primary follicles. Scale bars=100 μm. (d) The graph bar represents the quantification of the MOMA band width (μm) surrounding primary follicles. The band width was calculated on 7–10 different follicles per sample, performing four different measurements on each follicle. Samples from three different animals were analyzed in each case by two different investigators. The measurements of MOMA-1 band width were performed using the Leica application suite version 2.6.3 (Leica, Wetzlar, Germany). Data are the mean±S.E.M. Comparisons were made with a two-tailed Student t-test: *P<0.05; **P<0.01

